

Lawrence primer graphic
Foreword
The term "chaos" originally refers to the description of the chaotic state of the universe. The idea is that the result is inevitable, but because the existing knowledge cannot calculate the result, because the calculation itself is changing the result, the maximum or minimum result may appear at the end, and there is no necessity.
This is very similar to the trading market, where participants change the market when they analyze the market and put it into action. The market has eternal variability. When the participants understand the new form of the market, the market also knows that it is recognized by the participants, and the mutation happens.
And it will tend to mutate in the direction unknown to the participants. It has enough intelligence to prevent participants from capturing its changing laws. That is, the market is not stable, and the past understanding of the market cannot represent the future.
What is "Chaos operation"?

The "Chaos operation" method is a complete set of investment ideas, trading strategies and entry and exit signals, invented by Bill Williams. It has been popular in the United States since the end of the last century and has been recognized by many investment experts and professional traders.
At present, many investors in the world use "Chaos operation" method to participate in market trading. Because cryptocurrency financial market is a new market comparing to the traditional financial market, and chaos theory is also a relatively new trend idea in this market, there are few people studying "Chaos operation" methods in cryptocurrency market.
Since the "Chaos operation" method is a highly universal trading strategy, it can be applied to almost all financial investment fields, including stocks, bonds, futures, foreign exchange, and digital currency. Therefore, I hope to improve everyone's investment strategy through this article.
Chaotic algorithm architecture
As the name suggests, the theoretical basis of "Chaos operation" is chaos theory, which was proposed by meteorologist Edward Lorenz and is one of the greatest scientific discoveries of the late 20th century. The famous "butterfly effect" was proposed by him.
Bill Williams creatively applied chaos theory to the field of financial investment, and combined with fractal geometry, nonlinear dynamics and other disciplines, created a series of very effective technical analysis indicators.
The entire "Chaos operation" method is composed of five dimensions (technical indicators):
Alligator line
The Fractal
The Momentum
Acceleration
The Balance Line
Alligator line

The Alligator line (above) is a set of balanced lines that use fractal geometry and nonlinear dynamics. The essence is to extend the exponentially weighted moving average, which is one kind of moving average lines, but the calculation method is slightly more complicated than the ordinary moving average. First look at the definition of the the Alligator line:
//Parameter
N3:=N1+N2;
N4:=N2+N3;

//Define price midline
HL:=(H+L)/2;

//Alligator line
Y^^SMA(REF(HL,N3),N4,1);//lip kiss
R:=SMA(REF(HL,N2),N3,1);//Tooth
G:=SMA(REF(HL,N1),N2,1);//crotch
First define the price midline, which is the average of the highest price and the lowest price. For the "lip kiss", which means the small cycle of the midline is averaged again. For the "Tooth", which means the middle cycle of the midline is averaged again. and For the "crotch", which means the big cycle of the midline is averaged again. In actual trading, we use the crotch.
Fractal

The fractal (above) is to open palm in the front, with the finger facing up, the middle finger is the upper fractal, the little finger and the ring finger on the left, and the index finger and thumb on the right represent the K line that haven't reach the new high price. A basic fractal consists of these five K lines.
//fractal
TOP_N:=BARSLAST(REF(H,2)=HHV(H,5))+2;
BOTTOM_N:=BARSLAST(REF(L,2)=LLV(L,5))+2;

TOP:=REF(H,TOP_N);
BOTTOM:=REF(L,BOTTOM_N);

MAX_YRG^^MAX(MAX(Y,R),G);
MIN_YRG^^MIN(MIN(Y,R),G);

TOP_FRACTAL^^VALUEWHEN(H>=MAX_YRG,TOP);
BOTTOM_FRACTAL^^VALUEWHEN(L<=MIN_YRG,BOTTOM);
In the same way, the lower fractal is the finger pointing down. If the recent upper fractal is been breakthrough, and the price retracement does not fall below the nearest lower fractal, it can basically be judged that the market may turning bear to bull, and vice versa.
Strategy Logic

This strategy is based on the combination of the Alligator lines and fractal indicators of chaos theory. A set of exponentially weighted moving averages lines are used as the base price for the the Alligator line and fractal indicators.
//opening Long position: If currently there is no long position, and the closing price rises above the upper fractal, and the upper fractal is above the the Alligator line.
BKVOL=0 AND C>=TOP_FRACTAL AND TOP_FRACTAL>MAX_YRG,BPK;
//opening Short position: If currently there is no short position, and the closing price falls below the lower fractal, and the lower fractal is below the the Alligator line.
SKVOL=0 AND C<=BOTTOM_FRACTAL AND BOTTOM_FRACTAL<MIN_YRG,SPK;

//closing Long position: If the closing price falls below the the Alligator chin.
C<Y,SP(BKVOL);
//closing Short position: If the closing price rises above the the Alligator chin.
C>Y,BP(SKVOL);
opening Long position: If currently there is no long position, and the closing price rises above the upper fractal, and the upper fractal is above the the Alligator line.
opening Short position: If currently there is no short position, and the closing price falls below the lower fractal, and the lower fractal is below the the Alligator line.
closing Long position: If the closing price falls below the the Alligator chin.
closing Short position: If the closing price rises above the the Alligator chin.
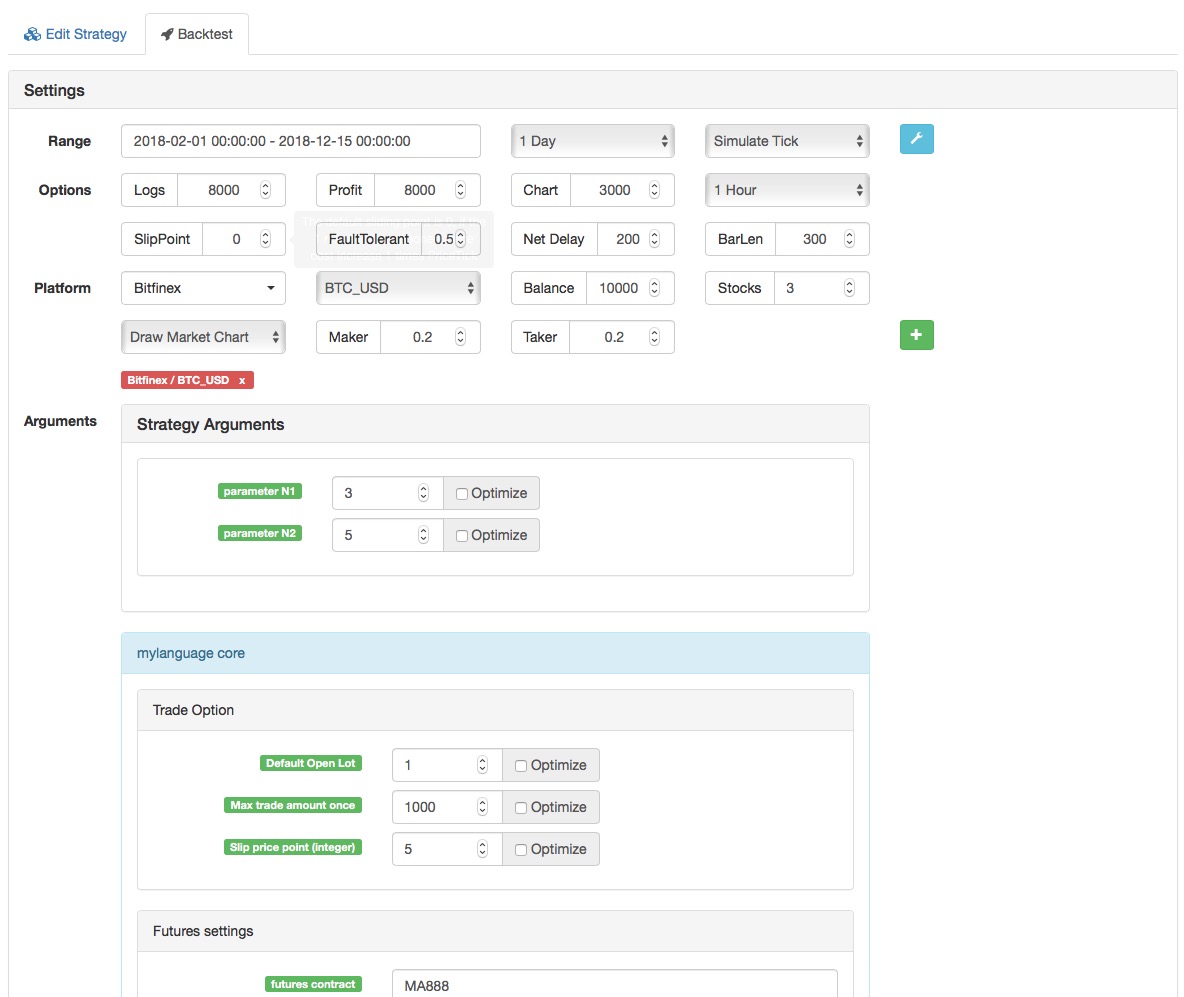
Strategy source
(*backtest
start: 2018-11-13 00:00:00
end: 2018-12-13 00:00:00
period: 1h
exchanges: [{"eid":"Huobi","currency":"BTC_USDT","balance":10000,"stocks":3}]
*)

N3:=N1+N2;
N4:=N2+N3;

HL:=(H+L)/2;

Y^^SMA(REF(HL,N3),N4,1);
R:=SMA(REF(HL,N2),N3,1);
G:=SMA(REF(HL,N1),N2,1);

TOP_N:=BARSLAST(REF(H,2)=HHV(H,5))+2;
BOTTOM_N:=BARSLAST(REF(L,2)=LLV(L,5))+2;

TOP:=REF(H,TOP_N);
BOTTOM:=REF(L,BOTTOM_N);

MAX_YRG^^MAX(MAX(Y,R),G);
MIN_YRG^^MIN(MIN(Y,R),G);

TOP_FRACTAL^^VALUEWHEN(H>=MAX_YRG,TOP);
BOTTOM_FRACTAL^^VALUEWHEN(L<=MIN_YRG,BOTTOM);

BKVOL=0 AND C>=TOP_FRACTAL AND TOP_FRACTAL>MAX_YRG,BPK;
SKVOL=0 AND C<=BOTTOM_FRACTAL AND BOTTOM_FRACTAL<MIN_YRG,SPK;

C<Y,SP(BKVOL);
C>Y,BP(SKVOL);
here is the strategy source link, you can open the link and run it directly:
Https://www.fmz.com/strategy/129077
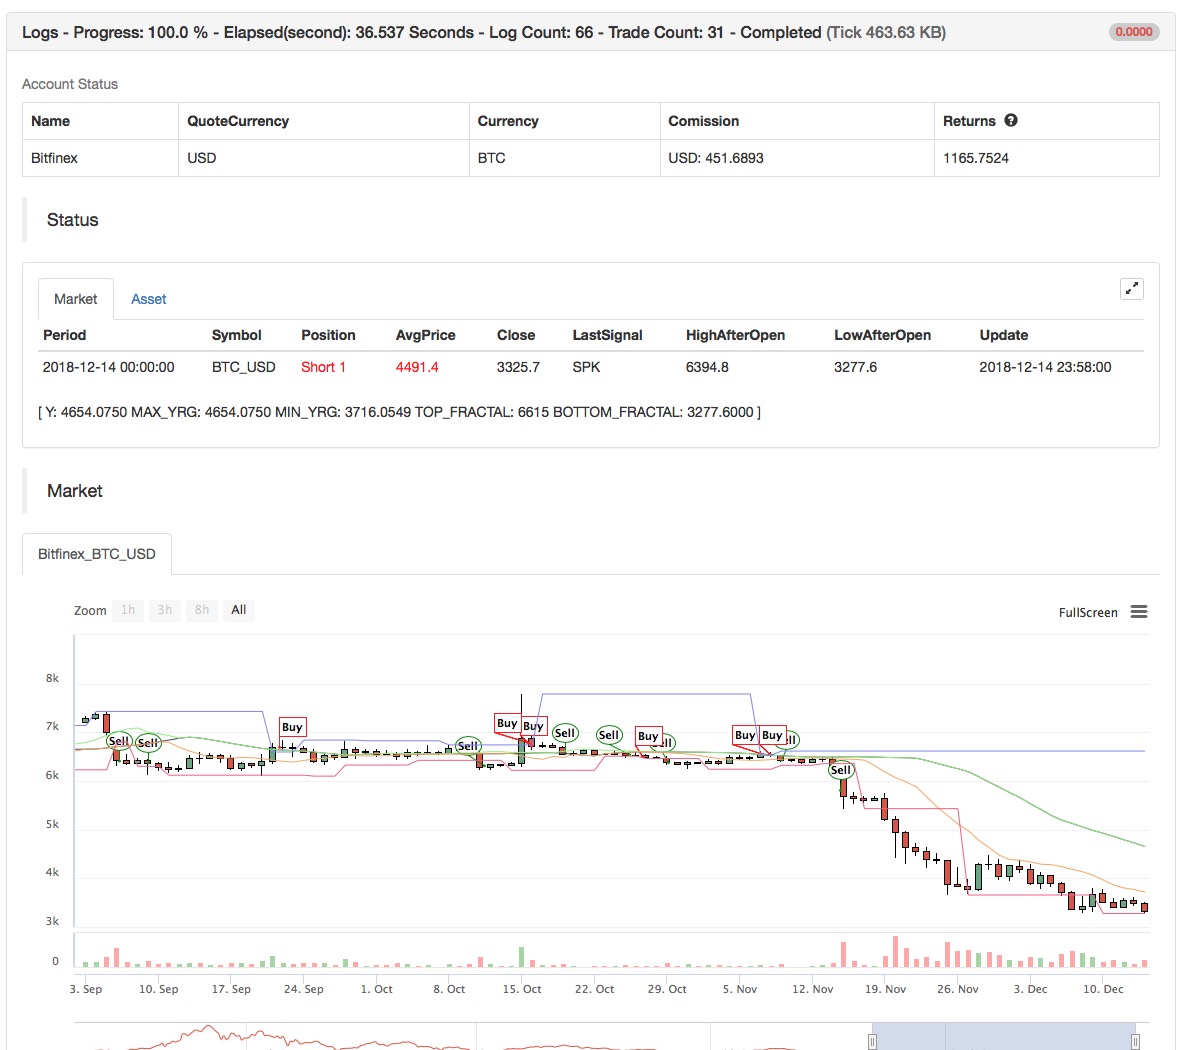
Backtest
In order to bring the backtesting closer to the real-market environment, the commission fee is set to be 2 times of the exchange standard, and the opening and closing positions price are added to the slippage of 2 pips. The back-tested data is used the houbi.com BTC_USDT futures.
To sum up
In summary, the essence of the "Chaos operation" method is to find a turning point, without having to care about how the market goes, and do not need to care about the true and false breakthroughs. If it breakthrough the fractal, the order will enter immediately. This is also the original intention of this article. Never try to predict the market, but to be an observer and follower.