As the name implies, the Moving Average (KAMA) belongs to the Moving Average category, but unlike the traditional moving average, it is way “smarter” than normal MA. We know that the MA has many shortcomings. For example, the short-term moving average is close to the price trend, which is very sensitive, but it is easy to produce false signals. The long-term moving average is very accurate in the trend capture, but often react very slow when the market price has moved for a while.
KAMA's "smartness" is reflected in the fact that it can be based on the current market state, that is, the volatility, to adjust the sensitivity. The form of its realization is: in the shock market, the change of KAMA is obviously slowed down; when the trend comes, it will quickly react.
The benefits are: it can reduce the transaction costs caused by the price "in-day moves", and can get on the trend in time when the market takes off.
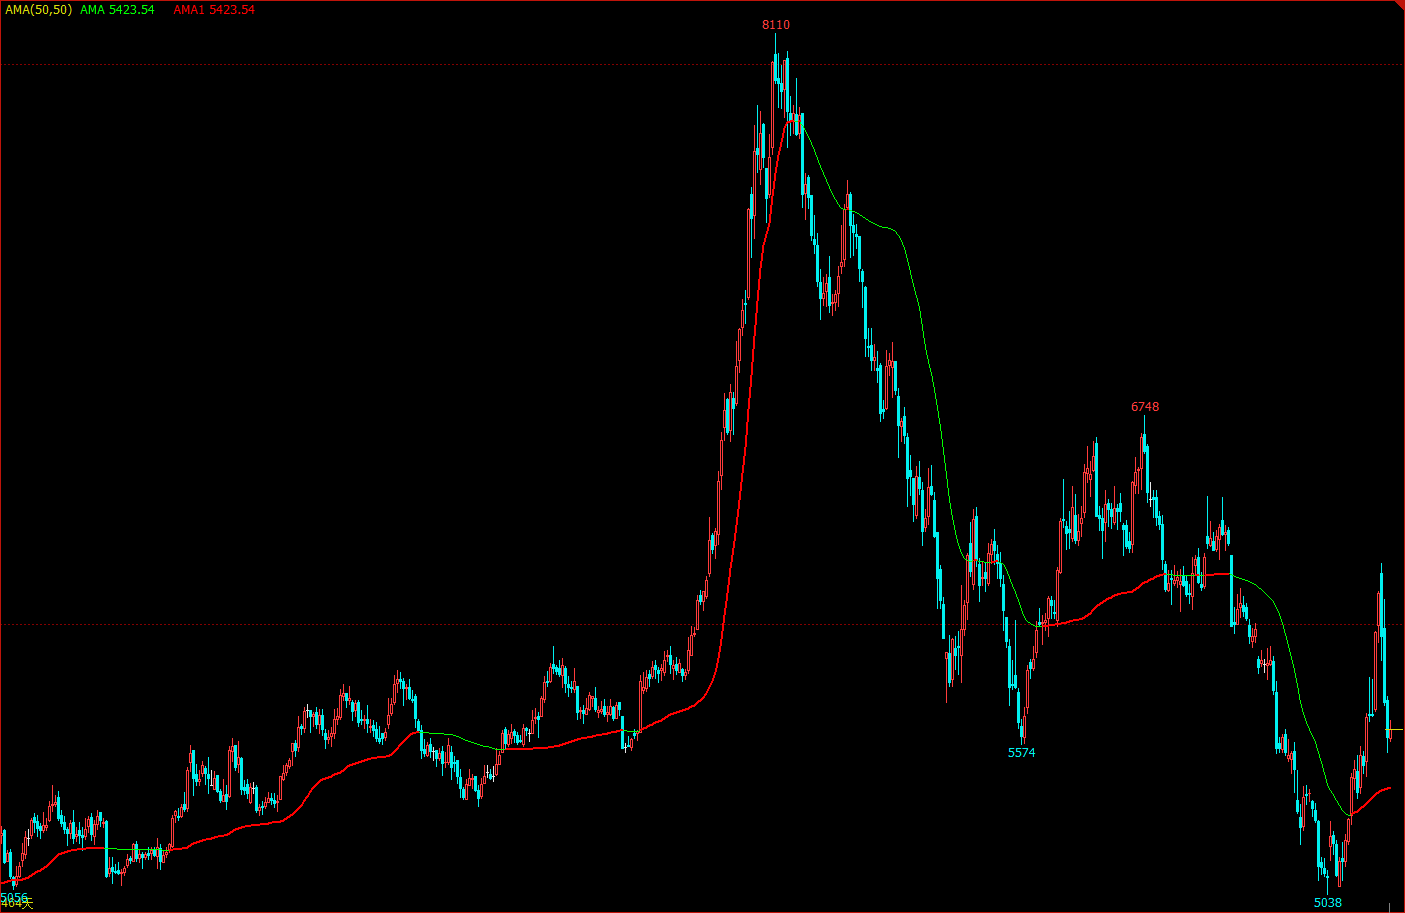
KAMA in the chart
KAMA calculation method
- Direction (DIR) = closing price - closing price before n days
- Volatility (VIR) = sum(abs (closing price - closing price of the previous trading day), n)
- Efficiency (ER) = direction / volatility
- Fast = 2 / (n1 + 1)
- Slow = 2 / (n2 + 1)
- Smooth (CS) = efficiency * (fast - slow) + slow
- Coefficient (CQ) = smooth * smooth
- KAMA = exponentially weighted average (dynamic moving average (closing price, coefficient), 2)
Among them, n, n1, and n2 are periodic parameters. By default, the number of n cycles is 10, n1 is the number of short-term cycles is 2, and n2 is the number of long-term cycles is 30. This is also a set of parameters agreed by KAMA author Perry Kaufman, n is used for direction and volatility calculation efficiency, n1 and n2 are the number of periods of fast moving average and slow moving average. Theoretically, the larger the parameter of n1, the smoother KAMA.
KAMA is calculated by first calculating the direction (DIR) and the volatility (VIR), then calculating the efficiency in proportion according to these two. Efficiency (ER) is a measure of the degree of price change and is calculated in a simple way: direction / volatility. The calculation result is between 0 and 1. When the value of ER is closer to 0, the market is in a state of oscillation. When the value of ER is closer to 1, the market is in a trend state.
When calculating the efficiency (ER), the smoothing constant (CS) can be derived by combining the fast moving average and the slow moving average:
efficiency * (fast - slow) + slow
CS represents the speed of the trend operation. According to the calculation formula of CS, we can find that the change of CS is always proportional to the change of ER.
Then the coefficient (CQ) is calculated according to the smoothed power, and the purpose is to make the slow cycle parameter play a more important role in the calculation, which is also a more conservative approach.
The final smoothness of KAMA is determined by the coefficient (CQ). In the calculation of KAMA, the coefficient (CQ) determines the periodic parameters of the last two moving average smoothing, namely: exponential weighted average (dynamic moving average (closing price, coefficient), 2).
How to use KAMA
Although KAMA's calculation method is very complicated, the usage method is similar to the ordinary moving average. In practical applications, it can not only judge the market trend, but also can be used for precise trading points. Because it is very "smart", it can be used in many trading targets, even in cryptocurrency market.
- When the price is greater than KAMA and KAMA is up, the long position is opened.
- When the price is less than KAMA and KAMA is down, the short position is opened.
- When the price is less than KAMA, or KAMA is down, the long position is closed.
- When the price is greater than KAMA, or KAMA is up, the short position is closed.
Building a trading strategy based on KAMA
Step 1: calculate KAMA
Note that in the upper left corner, please select the programming language: My language. There is already a ready-made KAMA in the talib library, but it has only one external parameter (n) cycle, and n1 and n2 have defaulted to 2 and 30.
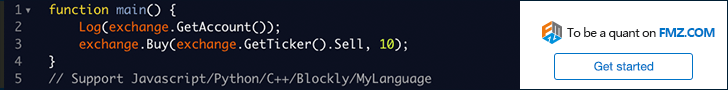
The strategies in this article are only used as references. Readers with strong programming ability can write their own. During the My language programming process, we can also mix with the JavaScript language, pay attention to the following code:
%% // Standard format for JavaScript within My language
scope.KAMA = function() {
    Var r = _C(exchange.GetRecords); // Get the K line array
    If (r.length > 140) { // filter the length of the K line
        Var kama = talib.KAMA(r, 140); // Call talib library to calculate KAMA
        Return kama[kama.length - 2]; // return the specific value of KAMA
    }
    Return;
}
%% // Standard format for JavaScript within My language
Step 2: Calculate the trading conditions and place an order
%%
scope.KAMA = function() {
    Var r = _C(exchange.GetRecords);
    If (r.length > 140) {
        Var kama = talib.KAMA(r, 140);
        Return kama[kama.length - 2];
    }
    Return;
}
%%

K^^KAMA; // Print KAMA on the chart
A:CLOSE; // print the closing price on the chart

K > REF(K, 1) && CLOSE > K,BK; // Open long position
K < REF(K, 1) && CLOSE < K,SK; // Open short position
K < REF(K, 1) || CLOSE < K,SP; // close long position
K > REF(K, 1) || CLOSE > K,BP; // close short position
Step 3: Set the strategy signal filtering method
%%
scope.KAMA = function() {
    Var r = _C(exchange.GetRecords);
    If (r.length > 140) {
        Var kama = talib.KAMA(r, 140);
        Return kama[kama.length - 2];
    }
    Return;
}
%%

K^^KAMA;
A:CLOSE;

K > REF(K, 1) && CLOSE > K,BK;
K < REF(K, 1) && CLOSE < K,SK;
K < REF(K, 1) || CLOSE < K,SP;
K > REF(K, 1) || CLOSE > K,BP;

AUTOFILTER; // Enable one open and one close signal filtering mechanism
Strategy backtest
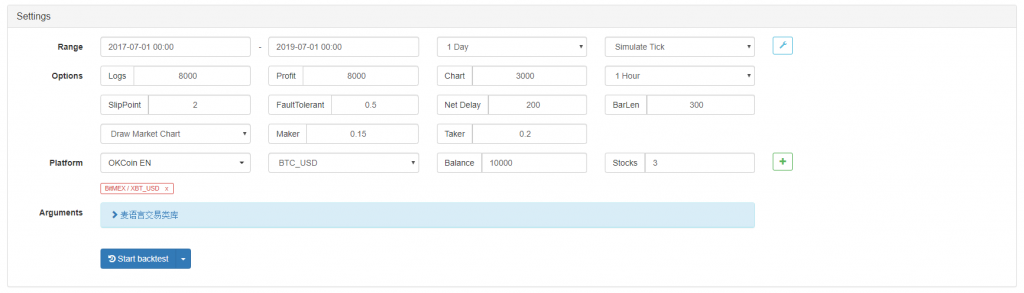
In order to get closer to the real trading environment, we used the 2 pips of slippage to test the pressure in the actual trading. The test environment is as follows:
- Exchange: BitMEX
- Trading Variety: XBTUSD
- Time: July 01, 2017 ~ July 01, 2019
- K line cycle: daily line
- Slippage: 2 pips for opening and closing positions
Backtest environment
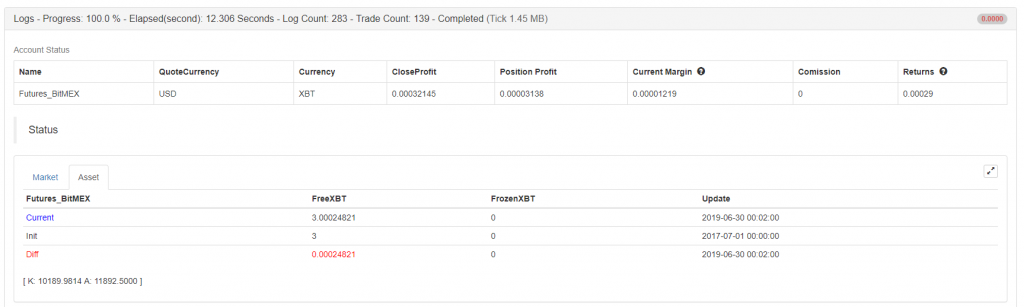
Profit Details
Fund curve
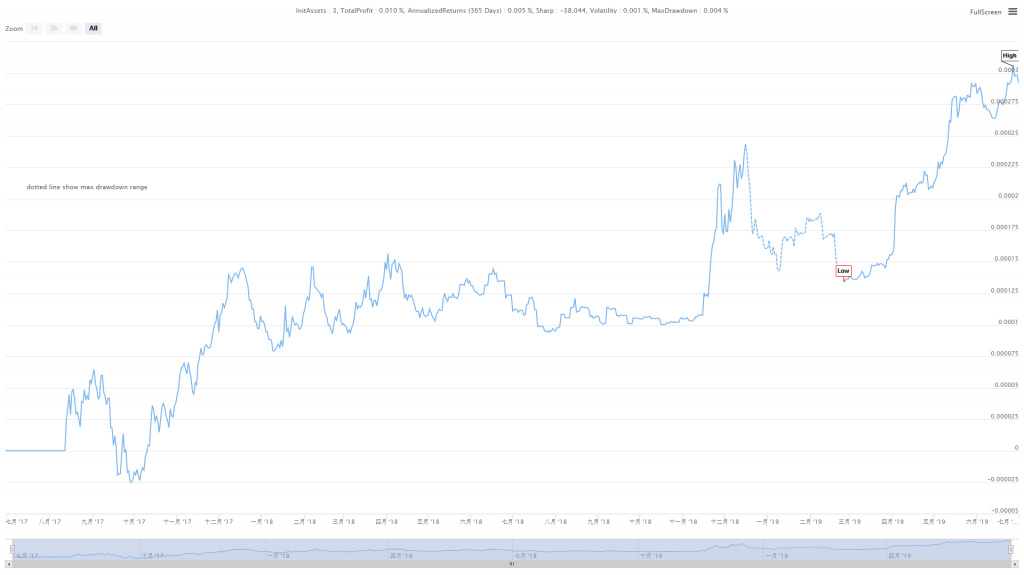
From the above backtest results, this simple KAMA strategy really live up to expectations. Even in the super-big bear market of the cryptocurrency in 2018, the capital curve did not show a large retracement, and there was no repeatedly open and close position in the long-term shock period in the market causing unnecessary losses. At the later time, there is a very good performance in the bull market in 2019.
Strategy source code
For more information, please check us at : https://www.fmz.com/strategy/155663
Summary
An excellent strategy that can be a firm strategy must be polished. The strategies in this article have a lot of space to optimize and upgrade, such as adding certain filtering conditions, active stop-loss and stop-loss conditions. As a kind of moving average, KAMA inherits the advantages and disadvantages of ordinary moving averages and at the same time sublimates. In an unpredictable market, even if you fix a "best parameter", it is difficult to adapt to the future market. Therefore, this method of changing with the trend and changing with the market may be a better choice.