In the previous article, we thought and designed a simple multi-species grid strategy together. Next, we will continue to learn and move forward on the path of quantitative trading. In this article, we will explore a more complex strategy design - the design of hedging strategies. This article plans to design a multi-species intertemporal hedging strategy. When it comes to intertemporal hedging strategies, those who are familiar with futures trading must be familiar with it. For beginners, they may not understand these concepts, so let's start with a brief explanation of the concept of intertemporal hedging.
Intertemporal hedging
Simply put, intertemporal hedging is to go long a contract, go short a contract, and wait for three situations (long and short) to close the position at the same time:
- If you make money by going long and lose money by going short, and close your position when the profit (as the saying goes) is more than the loss (as the saying goes), you will make a profit after the profit/loss balance.
- Long positions lose money, short positions make money, and close the position when the one is more profitable than the one that loses, … (same as above).
- Make money if you go long, and make money if you go short, so what's the hesitation? Close your position!
In other cases are floating losses, carrying or continuing to scale in the position. (Because the spread fluctuation is more moderate than the unilateral fluctuation, the relative risk is smaller, note that only relative!)
Let A1 be the price of contract A at moment 1, and set B1 to be the price of contract B at moment 1. At this time, short contract A, short price A1, long contract B, and long price B1.
Let A2 be the price of contract A at moment 2, and set B2 to be the price of contract B at moment 2. At this time, close the position contract A (short), close short A2, close the position B contract (long), and close long price B2.

Moment 1 difference:A1 - B1 = X
Moment 2 difference:A2 - B2 = Y
X - Y = A1 - B1 - (A2 - B2)
X - Y = A1 - B1 - A2 + B2
X - Y = A1 - A2 + B2 - B1

It can be seen that A1 - A2 is the profit difference in closing the position of contract A.
B2 - B1 is the profit spread of closing the position of contract B. As long as the two closed positions are overall positive, ie: A1 - A2 + B2 - B1 > 0 is profitable. That is, as long as X - Y > 0.
Because of: X - Y = A1 - A2 + B2 - B1

It is concluded that as long as the difference X of opening a position is greater than the difference Y of closing a position, it is profitable (note that it is short A, long B to open a position, the reverse will be the opposite), of course, this is theoretical, practical factors such as commission and slippage should also be considered.
Because cryptocurrency exchanges have both delivery contracts and perpetual contracts. And the price of perpetual contracts is always close to the spot price due to the funding rate. Then we choose to use delivery contracts and perpetual contracts to hedge arbitrage. The delivery contract chooses a longer-term contract, so that the hedging contract does not need to be set frequently.
Warm up with a multi-species spread statistic first
Once you are familiar with the basic principles, you don't have to rush into writing strategies. First of all, you can get a spread statistic, draw a chart and observe the spreads. Let's learn how to draw a multi-species strategy together.
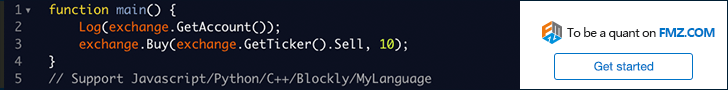
We design based on the OKX contract. It is very simple to draw on FMZ. It is very easy to use the packaged functions to draw. The chart library is Highcharts. The drawing function description on the API documentation: https://www.fmz.com/api#chart…
Since it is a multi-species, first of all, it is necessary to determine the price difference of those species before drawing. In the code, write two arrays first, representing the contracts to be done.
var arrSwapContractType = ["BTC-USDT-SWAP", "LTC-USDT-SWAP", "ETH-USDT-SWAP", "ETC-USDT-SWAP"]   // Perpetual contracts
var arrDeliveryContractType = ["BTC-USDT-210924", "LTC-USDT-210924", "ETH-USDT-210924", "ETC-USDT-210924"]  // Delivery contracts
Initialize the chart configuration according to the contract code set up here. This chart configuration certainly can't be hard-coded, because you don't know what species and how many species to do (these are determined by the values of arrDeliveryContractType and arrSwapContractType), so the chart configuration is returned by a function.
function createCfg(symbol) {
    var cfg = {
        extension: {
            // No grouping, displayed separately, default is 'group'
            layout: 'single',
            // Specify the height, which can be set as a string, "300px", and the value 300 will be replaced with "300px" automatically
            height: 300,
            // The unit value of the specified width, the total value is 12
            col: 6
        },
        title: {
            text: symbol
        },
        xAxis: {
            type: 'datetime'
        },
        series: [{
            name: 'plus',
            data: []
        }]
    }

    return cfg
}

function main() {
    // Declare arrCfg
    var arrCfg = []                                    // Declare an array to store chart configuration information
    _.each(arrSwapContractType, function(ct) {         // Record the array of perpetual contract codes iteratively, pass the XXX-USDT part of the contract name as a parameter to the createCfg function, construct the chart configuration information, and return
        arrCfg.push(createCfg(formatSymbol(ct)[0]))    // The chart configuration information returned by createCfg is pushed into the arrCfg array
    })
    var objCharts = Chart(arrCfg)                      // Call the chart function Chart of the FMZ platform to create the chart control object objCharts
    objCharts.reset()                                  // Initialize chart content

    // Hereafter omitted ...
}
Next, let's prepare the data. We use the aggregated market interface of the OKEX contract:
USDT perpetual contracts:
https://www.okex.com/api/v5/market/tickers?instType=SWAP
USDT delivery contracts:
https://www.okex.com/api/v5/market/tickers?instType=FUTURES
We write a function to handle the calls of these two interfaces and put the data into a format:
function getTickers(url) {
    var ret = []
    try {
        var arr = JSON.parse(HttpQuery(url)).data
        _.each(arr, function(ele) {
            ret.push({
                bid1: parseFloat(ele.bidPx),             // Price of stock buy order
                bid1Vol: parseFloat(ele.bidSz),          // Amount for the price of stock buy order
                ask1: parseFloat(ele.askPx),             // Price of stock sell order
                ask1Vol: parseFloat(ele.askSz),          // Amount for the price of stock sell order
                symbol: formatSymbol(ele.instId)[0],     // Formats into trading pairs
                type: "Futures",                         // Type
                originalSymbol: ele.instId               // Original contract code
            })
        })
    } catch (e) {
        return null
    }
    return ret
}
Write another function to process the contract code
function formatSymbol(originalSymbol) {
    var arr = originalSymbol.split("-")
    return [arr[0] + "_" + arr[1], arr[0], arr[1]]
}
All that's left is to pair the acquired data iteratively, calculate the spreads, chart the output, etc.
The test here is the spread between the second quarter contract 210924 and the perpetual contract.
Complete code:
// Temporary parameters
var arrSwapContractType = ["BTC-USDT-SWAP", "LTC-USDT-SWAP", "ETH-USDT-SWAP", "ETC-USDT-SWAP"]
var arrDeliveryContractType = ["BTC-USDT-210924", "LTC-USDT-210924", "ETH-USDT-210924", "ETC-USDT-210924"]
var interval = 2000

function createCfg(symbol) {
    var cfg = {
        extension: {
            // No grouping, displayed separately, default is 'group'
            layout: 'single',
            // Specify the height, which can be set as a string, "300px", and the value 300 will be replaced with "300px" automatically
            height: 300,
            // The unit value of the specified width, the total value is 12
            col: 6
        },
        title: {
            text: symbol
        },
        xAxis: {
            type: 'datetime'
        },
        series: [{
            name: 'plus',
            data: []
        }]
    }

    return cfg
}

function formatSymbol(originalSymbol) {
    var arr = originalSymbol.split("-")
    return [arr[0] + "_" + arr[1], arr[0], arr[1]]
}

function getTickers(url) {
    var ret = []
    try {
        var arr = JSON.parse(HttpQuery(url)).data
        _.each(arr, function(ele) {
            ret.push({
                bid1: parseFloat(ele.bidPx),
                bid1Vol: parseFloat(ele.bidSz),
                ask1: parseFloat(ele.askPx),
                ask1Vol: parseFloat(ele.askSz),
                symbol: formatSymbol(ele.instId)[0],
                type: "Futures",
                originalSymbol: ele.instId
            })
        })
    } catch (e) {
        return null
    }
    return ret
}

function main() {
    // Declare arrCfg
    var arrCfg = []
    _.each(arrSwapContractType, function(ct) {
        arrCfg.push(createCfg(formatSymbol(ct)[0]))
    })
    var objCharts = Chart(arrCfg)
    objCharts.reset()

    while (true) {
        // Obtain market data
        var deliveryTickers = getTickers("https://www.okex.com/api/v5/market/tickers?instType=FUTURES")
        var swapTickers = getTickers("https://www.okex.com/api/v5/market/tickers?instType=SWAP")
        if (!deliveryTickers || !swapTickers) {
            Sleep(2000)
            continue
        }

        var tbl = {
            type : "table",
            title : "delivery - perpetual spread",
            cols : ["trading pairs", "delivery", "perpetual", "positive hedging", "negative hedging"],
            rows : []
        }

        var subscribeDeliveryTickers = []
        var subscribeSwapTickers = []
        _.each(deliveryTickers, function(deliveryTicker) {
            _.each(arrDeliveryContractType, function(symbol) {
                if (deliveryTicker.originalSymbol == symbol) {
                    subscribeDeliveryTickers.push(deliveryTicker)
                }
            })
        })
        _.each(swapTickers, function(swapTicker) {
            _.each(arrSwapContractType, function(symbol) {
                if (swapTicker.originalSymbol == symbol) {
                    subscribeSwapTickers.push(swapTicker)
                }
            })
        })

        var pairs = []
        var ts = new Date().getTime()
        _.each(subscribeDeliveryTickers, function(deliveryTicker) {
            _.each(subscribeSwapTickers, function(swapTicker) {
                if (deliveryTicker.symbol == swapTicker.symbol) {
                    var pair = {symbol: swapTicker.symbol, swapTicker: swapTicker, deliveryTicker: deliveryTicker, plusDiff: deliveryTicker.bid1 - swapTicker.ask1, minusDiff: deliveryTicker.ask1 - swapTicker.bid1}
                    pairs.push(pair)
                    tbl.rows.push([pair.symbol, deliveryTicker.originalSymbol, swapTicker.originalSymbol, pair.plusDiff, pair.minusDiff])
                    for (var i = 0 ; i < arrCfg.length ; i++) {
                        if (arrCfg[i].title.text == pair.symbol) {
                            objCharts.add([i, [ts, pair.plusDiff]])
                        }
                    }
                }
            })
        })

        LogStatus(_D(), "\n`" + JSON.stringify(tbl) + "`")
        Sleep(interval)
    }
}
Bot Operation
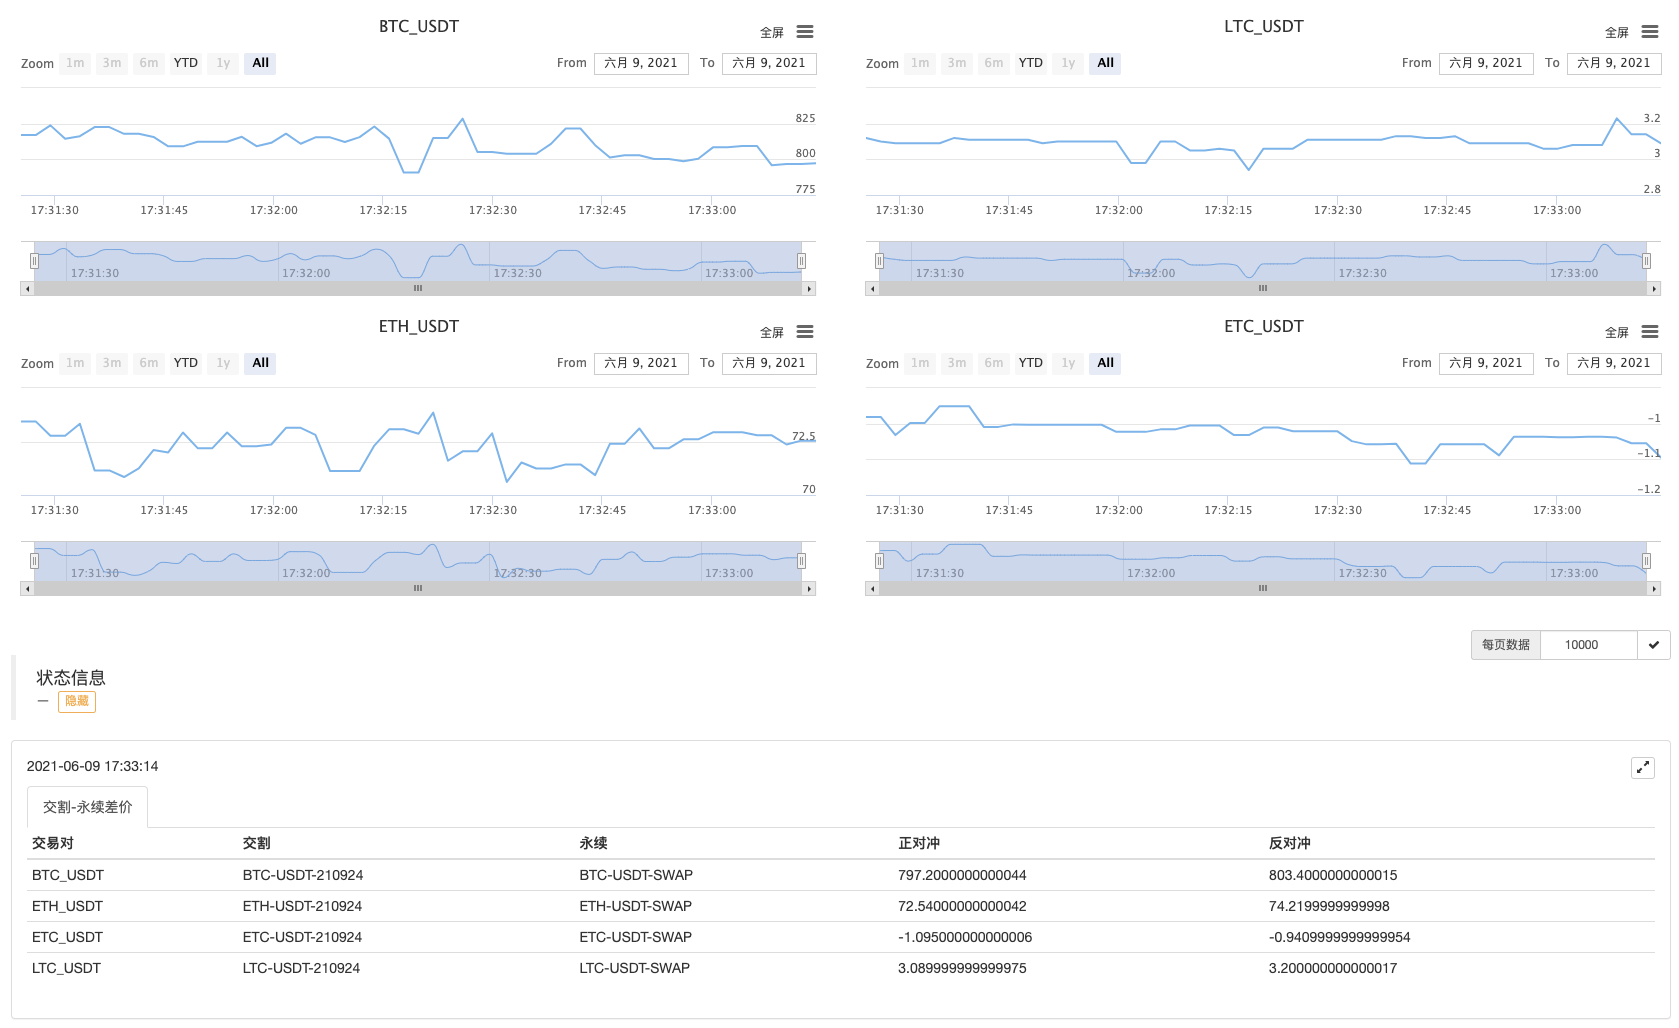
Run for a while.
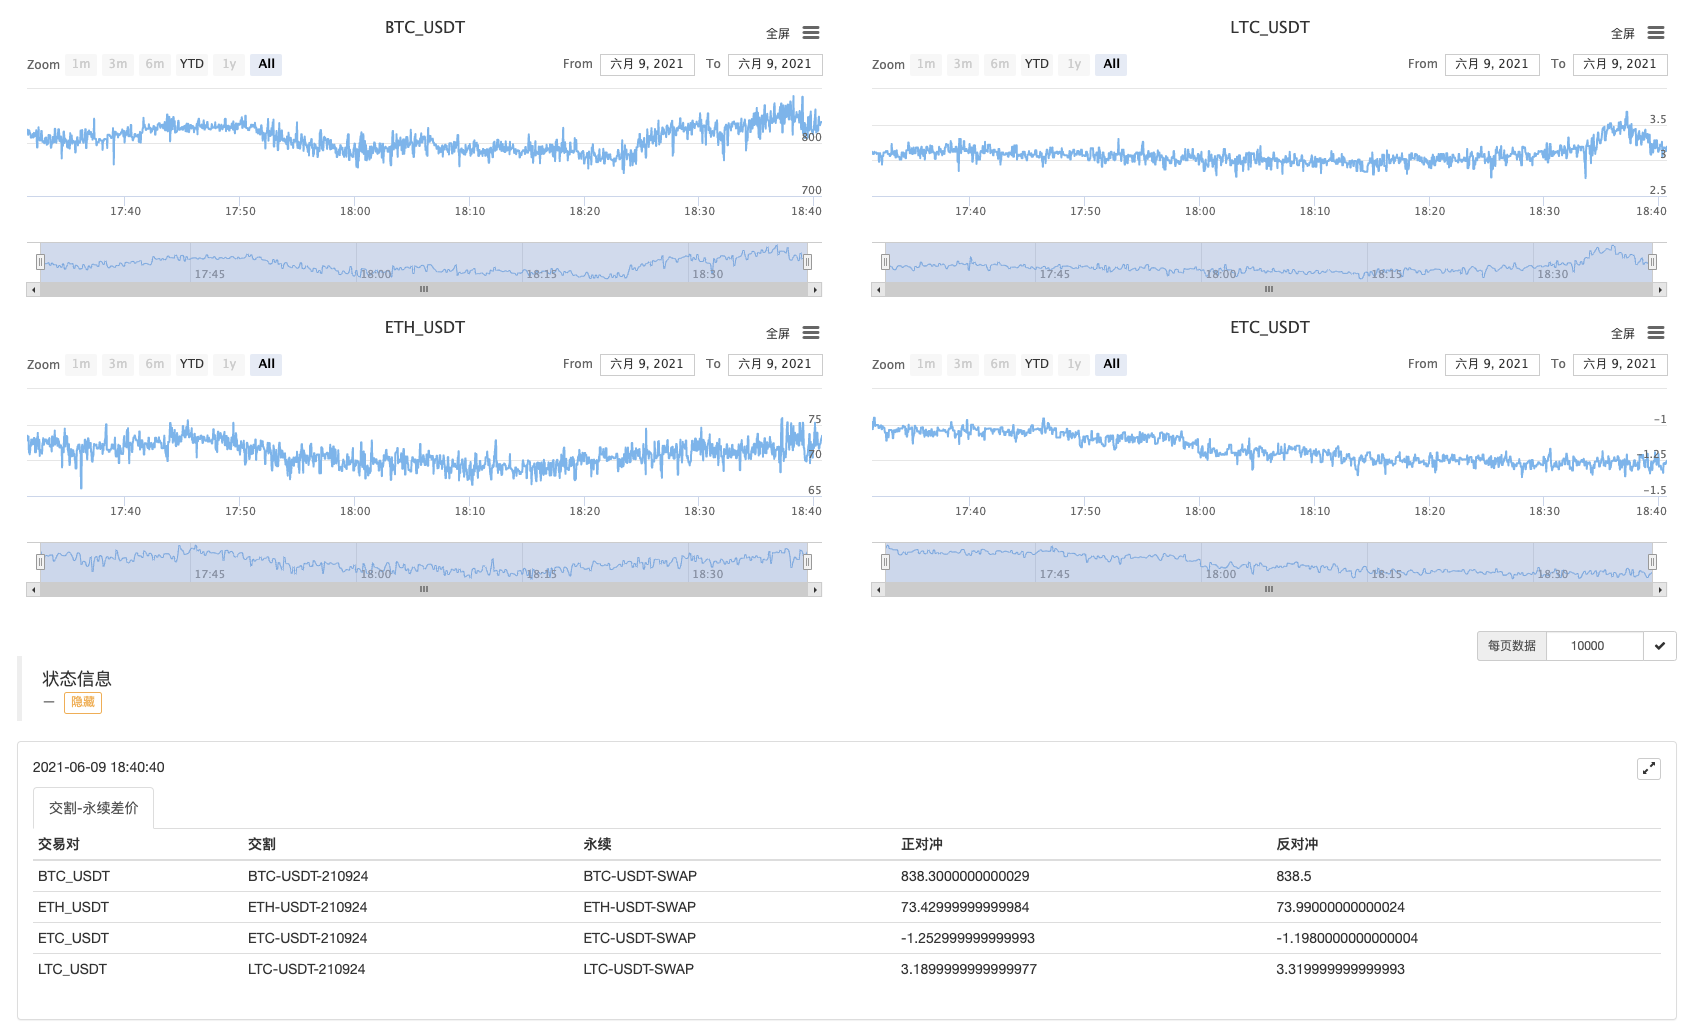
Observe the spreads first!