Skip to content
Hot News

A Retail Investor’s Self-Discipline Journey: Using AI to Block 80% of Bad Trades

RWA New Strategy: A Step-by-Step Guide to Automated US Stock Token Trading with Inventor Workflow

From Manual Analysis to Automation: Building Aster Smart Money Tracking Tool on Inventor Platform

Demystifying Crypto Influencers: A Professional Analysis System for Replicating Founder Workflows

A New Paradigm in Quantitative Trading: A Guide to Workflow Development on the FMZ Platform

Python Multi-Currency Quantitative Strategy Framework: Design Concepts and Implementation Details

FMZ Quant

Building An Extraordinary Quantitative World

  • Home
  • Announcement
  • Strategies
  • Experience
  • Reading List
  • Tools
  • Tutorials
Menu
  • Home
  • Announcement
  • Strategies
  • Experience
  • Reading List
  • Tools
  • Tutorials
Wednesday, February 4, 2026
  • Strategies

Teach you to encapsulate a Python strategy into a local file

Many developers who write strategies in Python want to put the strategy code files locally, worrying about the safety of the strategy. As a solution proposed in the FMZ API document: Strategy security...

zero
July 9, 2020
Read More
  • Strategies

FMEX trading unlocks the optimal order volume optimization Part 2

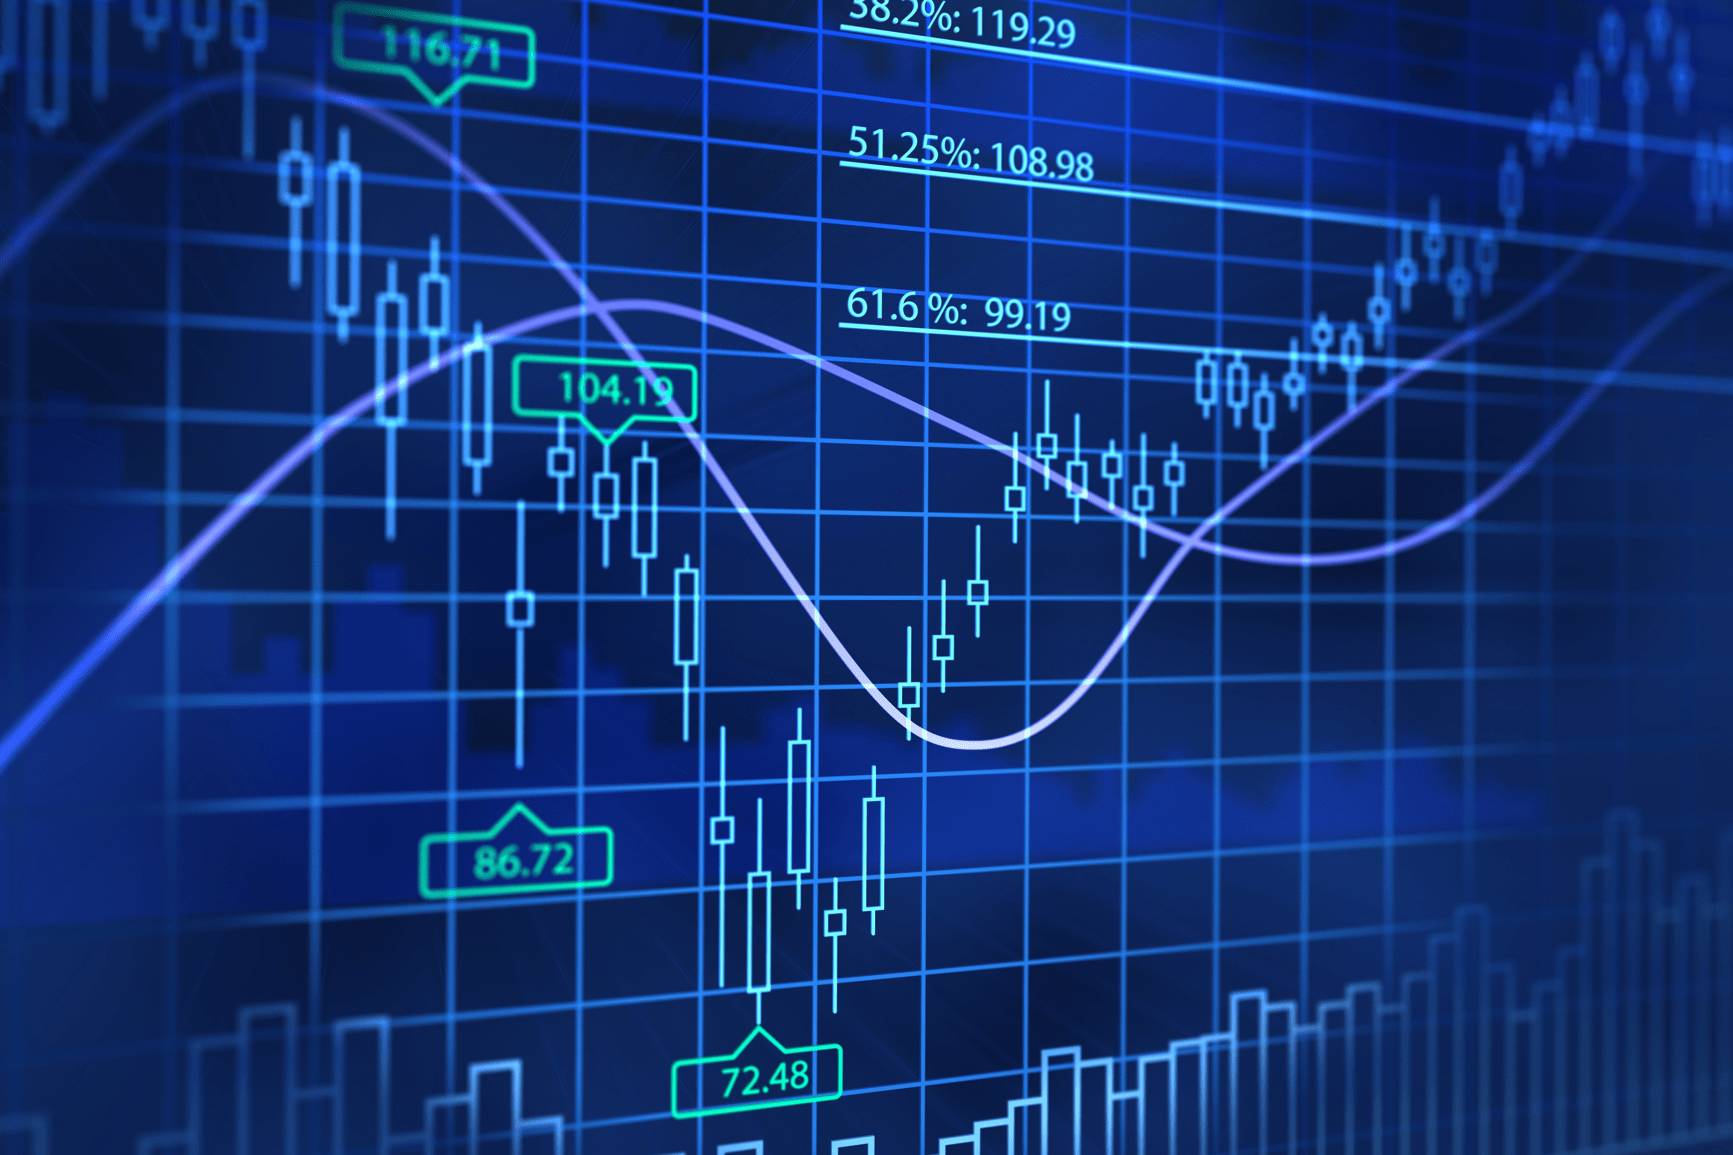
The collapse of FMEX has harmed many people, but it recently came up with a restart plan and formulated rules similar to the original mining to unlock their debt. For transaction mining, I have given ...

zero
July 7, 2020
Read More
  • Experience

FMEX trading unlocks the optimal order volume optimization

FMEX’s shutdown has entrapped a lot of traders, it recently came up with a restart plan, and developed rules similar to the original “trading is mining” for unlocking debt. Trading u...

zero
July 3, 2020
Read More
  • Strategies

Analysis and Realization of Commodity Futures Volume Footprint Chart

Summary Quantum footprint chart is an advanced chart analysis tool, the English name is “Footprint Charts”. It shows the trading activity of each price in a single K line. In addition to p...

zero
July 3, 2020
Read More
  • Strategies

Simple Volatility EMV Strategy

Summary Unlike other technical indicators, “Ease of Movement Value” reflects changes in price, volume, and popularity. It is a technology that combines prices and volume changes. It measur...

zero
July 1, 2020
Read More
12
Copyright © 2026 FMZ Quant | Powered by News Magazine X