Recently, some of our platform users are looking forward to transplanting a MyLanguage strategy into a JavaScript strategy, which can flexibly add many optimization ideas. Even expand the strategy to multi-species versions. Because the MyLanguage strategy is usually a trend strategy, and many of them are executed based on the closing price model. The API interface of the strategy request exchange is not very frequent, which is suitable for transplanting to multi-species strategy version. In this article, we will take a simple MyLanguage strategy as an example to transplant it into a simple version of JavaScript language. The main purpose is teaching and backtesting research. If you want to make a real bot, you may need to add some details (order price, quantity accuracy, order quantity control, order by asset percentage, status information display, etc.), and also need real bot test.
The Strategy of the MyLanguage to be Transplanted
TR:=MAX(MAX((H-L),ABS(REF(C,1)-H)),ABS(REF(C,1)-L));
ATR:=EMA(TR,LENGTH2);

MIDLINE^^EMA((H + L + C)/3,LENGTH1);
UPBAND^^MIDLINE + N*ATR;
DOWNBAND^^MIDLINE - N*ATR;


BKVOL=0 AND C>=UPBAND AND REF(C,1)<REF(UPBAND,1),BPK;
SKVOL=0 AND C<=DOWNBAND AND REF(C,1)>REF(DOWNBAND,1),SPK;

BKVOL>0 AND C<=MIDLINE,SP(BKVOL);
SKVOL>0 AND C>=MIDLINE,BP(SKVOL);
// stop loss
// stop loss
C>=SKPRICE*(1+SLOSS*0.01),BP;
C<=BKPRICE*(1-SLOSS*0.01),SP;
AUTOFILTER;
The trading logic of this strategy is simple. First, calculate ATR according to the parameters, then calculate the average of the highest, lowest and closing prices of all K-line BARs, and then calculate the EMA indicator according to the average data. Finally, combine ATR and coefficient N in parameters to calculate the upBand and downBand.
Opening and selling positions are based on the closing price. Open long positions when it surmount the upBand and sell the opening position (when holding short positions). Open short positions when it surmount the downBand and sell the opening position.
When the closing price reaches the midline, the position will be closed, and when the closing price reaches the stop loss price, the position will also be closed (stop loss according to the SLOSS, SLOSS is 1, that is 0.01, that is, 1%).
The strategy is executed in a closing price model.
OK, if we understand the strategic requirements and ideas of MyLanguage, we can start to transplant them.
Transplant and Design Strategy Prototype
There are not many strategy prototype codes, ranging from 1 to 200 lines. In order to facilitate the learning of strategy writing ideas, comments are directly written in the strategy code.
// parse params parameters, and parse strings as objects
var arrParam = JSON.parse(params)

// this function creates a chart configuration
function createChartConfig(symbol, atrPeriod, emaPeriod, index) {   // symbol : trading pair, atrPeriod : ATR parameter period , emaPeriod : EMA parameter period, exchange object index corresponding to index
    var chart = {
        __isStock: true,
        extension: {
                layout: 'single',
                height: 600,
        },
        title : { text : symbol},
        xAxis: { type: 'datetime'},
        series : [
            {
                type: 'candlestick',    // K-line data series
                name: symbol,
                id: symbol + "-" + index,
                data: []
            }, {
                type: 'line',           // EMA
                name: symbol + ',EMA:' + emaPeriod,
                data: [],
            }, {
                type: 'line',           // upBand
                name: symbol + ',upBand' + atrPeriod,
                data: []
            }, {
                type: 'line',           // downBand
                name: symbol + ',downBand' + atrPeriod,
                data: []
            }, {
                type: 'flags',
                onSeries: symbol + "-" + index,
                data: [],
            }
        ]
    }
    return chart
}

// main Logic
function process(e, kIndex, c) {    // e is the exchange object, exchanges [0]..., kIndex is the K-line data series in the chart, and c is the chart object
    // obtain K-line data
    var r = e.GetRecords(e.param.period)
    if (!r || r.length < e.param.atrPeriod + 2 || r.length < e.param.emaPeriod + 2) {
        // if the K-line data length is insufficient, return
        return
    }

    // calculate ATR indicators
    var atr = TA.ATR(r, e.param.atrPeriod)
    var arrAvgPrice = []
    _.each(r, function(bar) {
        arrAvgPrice.push((bar.High + bar.Low + bar.Close) / 3)
    })
    // calculate EMA indicators
    var midLine = TA.EMA(arrAvgPrice, e.param.emaPeriod)
    // calculate upBand and downBand
    var upBand = []
    var downBand = []
    _.each(midLine, function(mid, index) {
        if (index < e.param.emaPeriod - 1 || index < e.param.atrPeriod - 1) {
            upBand.push(NaN)
            downBand.push(NaN)
            return
        }
        upBand.push(mid + e.param.trackRatio * atr[index])
        downBand.push(mid - e.param.trackRatio * atr[index])
    })

    // draw the chart
    for (var i = 0 ; i < r.length ; i++) {
        if (r[i].Time == e.state.lastBarTime) {
            // update
            c.add(kIndex, [r[i].Time, r[i].Open, r[i].High, r[i].Low, r[i].Close], -1)
            c.add(kIndex + 1, [r[i].Time, midLine[i]], -1)
            c.add(kIndex + 2, [r[i].Time, upBand[i]], -1)
            c.add(kIndex + 3, [r[i].Time, downBand[i]], -1)
        } else if (r[i].Time > e.state.lastBarTime) {
            // add
            e.state.lastBarTime = r[i].Time
            c.add(kIndex, [r[i].Time, r[i].Open, r[i].High, r[i].Low, r[i].Close])
            c.add(kIndex + 1, [r[i].Time, midLine[i]])
            c.add(kIndex + 2, [r[i].Time, upBand[i]])
            c.add(kIndex + 3, [r[i].Time, downBand[i]])
        }
    }

    // check the position
    var pos = e.GetPosition()
    if (!pos) {
        return
    }
    var holdAmount = 0
    var holdPrice = 0
    if (pos.length > 1) {
        throw "long and short positions are checked at the same time!"
    } else if (pos.length != 0) {
        holdAmount = pos[0].Type == PD_LONG ? pos[0].Amount : -pos[0].Amount
        holdPrice = pos[0].Price
    }

    if (e.state.preBar == -1) {
        e.state.preBar = r[r.length - 1].Time
    }
    // check the signal
    if (e.state.preBar != r[r.length - 1].Time) {   // closing price model
        if (holdAmount <= 0 && r[r.length - 3].Close < upBand[upBand.length - 3] && r[r.length - 2].Close > upBand[upBand.length - 2]) {   // the closing price cross over the upBand
            if (holdAmount < 0) {   // hold a short positions, close them
                Log(e.GetCurrency(), "close short positions", "#FF0000")
                $.CoverShort(e, e.param.symbol, Math.abs(holdAmount))
                c.add(kIndex + 4, {x: r[r.length - 2].Time, color: 'red', shape: 'flag', title: 'close', text: "close short positions"})
            }
            // open long positions
            Log(e.GetCurrency(), "open long positions", "#FF0000")
            $.OpenLong(e, e.param.symbol, 10)
            c.add(kIndex + 4, {x: r[r.length - 2].Time, color: 'red', shape: 'flag', title: 'long', text: "open long positions"})
        } else if (holdAmount >= 0 && r[r.length - 3].Close > downBand[downBand.length - 3] && r[r.length - 2].Close < downBand[downBand.length - 2]) {  // the closing price cross down the downBand
            if (holdAmount > 0) {   // hold long positions, close them
                Log(e.GetCurrency(), "close long positions", "#FF0000")
                $.CoverLong(e, e.param.symbol, Math.abs(holdAmount))
                c.add(kIndex + 4, {x: r[r.length - 2].Time, color: 'green', shape: 'flag', title: 'close', text: "close long positions"})
            }
            // open short positions
            Log(e.GetCurrency(), "open short positions", "#FF0000")
            $.OpenShort(e, e.param.symbol, 10)
            c.add(kIndex + 4, {x: r[r.length - 2].Time, color: 'green', shape: 'flag', title: 'short', text: "open short positions"})
        } else {
            // close positions
            if (holdAmount > 0 && (r[r.length - 2].Close <= holdPrice * (1 - e.param.stopLoss) || r[r.length - 2].Close <= midLine[midLine.length - 2])) {   // Hold a long position, the closing price is less than or equal to the midline, stop loss at the opening price
                Log(e.GetCurrency(), "trigger midline or stop loss, close long positions", "#FF0000")
                $.CoverLong(e, e.param.symbol, Math.abs(holdAmount))
                c.add(kIndex + 4, {x: r[r.length - 2].Time, color: 'green', shape: 'flag', title: 'close', text: "close long positions"})
            } else if (holdAmount < 0 && (r[r.length - 2].Close >= holdPrice * (1 + e.param.stopLoss) || r[r.length - 2].Close >= midLine[midLine.length - 2])) {  // Hold a short position, the closing price is greater than or equal to the midline, stop loss at the opening price
                Log(e.GetCurrency(), "trigger midline or stop loss, close short positions", "#FF0000")
                $.CoverShort(e, e.param.symbol, Math.abs(holdAmount))
                c.add(kIndex + 4, {x: r[r.length - 2].Time, color: 'red', shape: 'flag', title: 'close', text: "close short positions"})
            }
        }
        e.state.preBar = r[r.length - 1].Time
    }
}

function main() {
    var arrChartConfig = []
    if (arrParam.length != exchanges.length) {
        throw "Parameters and exchange objects do not match!"
    }
    var arrState = _G("arrState")
    _.each(exchanges, function(e, index) {
        if (e.GetName() != "Futures_Binance") {
            throw "The exchange is not supported!"
        }
        e.param = arrParam[index]
        e.state = {lastBarTime: 0, symbol: e.param.symbol, currency: e.GetCurrency()}
        if (arrState) {
            if (arrState[index].symbol == e.param.symbol && arrState[index].currency == e.GetCurrency()) {
                Log("restore:", e.state)
                e.state = arrState[index]
            } else {
                throw "The restored data does not match the current settings!"
            }
        }
        e.state.preBar = -1   // initial setting -1
        e.SetContractType(e.param.symbol)
        Log(e.GetName(), e.GetLabel(), "set contracts:", e.param.symbol)
        arrChartConfig.push(createChartConfig(e.GetCurrency(), e.param.atrPeriod, e.param.emaPeriod, index))
    })
    var chart = Chart(arrChartConfig)
    chart.reset()

    while (true) {
        _.each(exchanges, function(e, index) {
            process(e, index + index * 4, chart)
            Sleep(500)
        })
    }
}

function onexit() {
    // record e.state
    var arrState = []
    _.each(exchanges, function(e) {
        arrState.push(e.state)
    })
    Log("record:", arrState)
    _G("arrState", arrState)
}
Strategy parameters:
var params = '[{
        "symbol" : "swap",    // contract code
        "period" : 86400,     // K-line period, 86,400 seconds is a day
        "stopLoss" : 0.07,    // stop loss factor, 0.07 or 7%
        "atrPeriod" : 10,     // ATR indicator parameters
        "emaPeriod" : 10,     // EMA indicator parameters
        "trackRatio" : 1,     // upBand and downBand coefficients
        "openRatio" : 0.1     // The reserved opening percentage, which is not supported for now
    }, {
        "symbol" : "swap",
        "period" : 86400,
        "stopLoss" : 0.07,
        "atrPeriod" : 10,
        "emaPeriod" : 10,
        "trackRatio" : 1,
        "openRatio" : 0.1
    }]'
Backtest
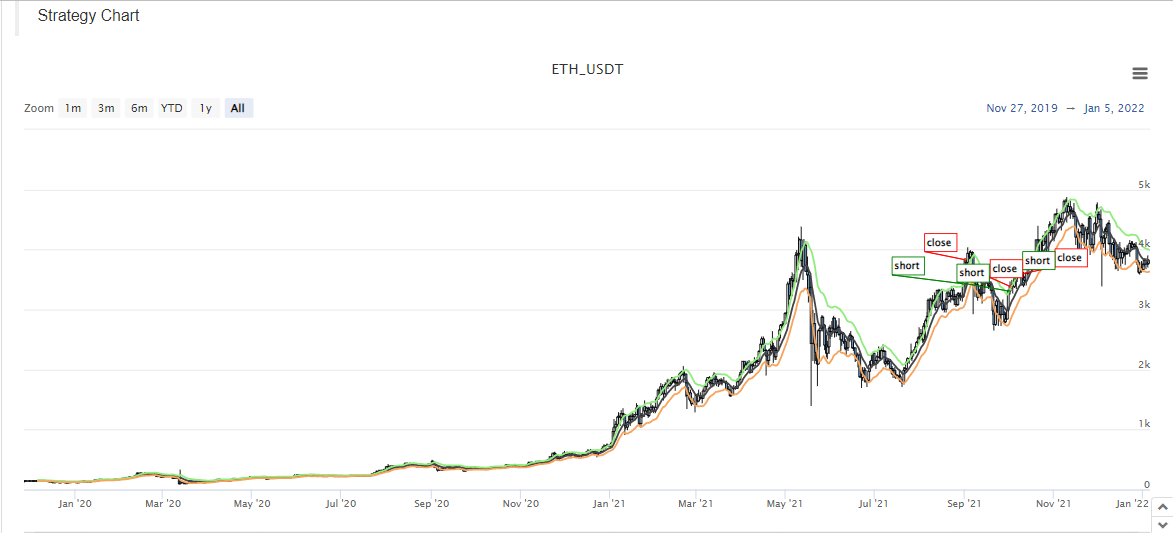
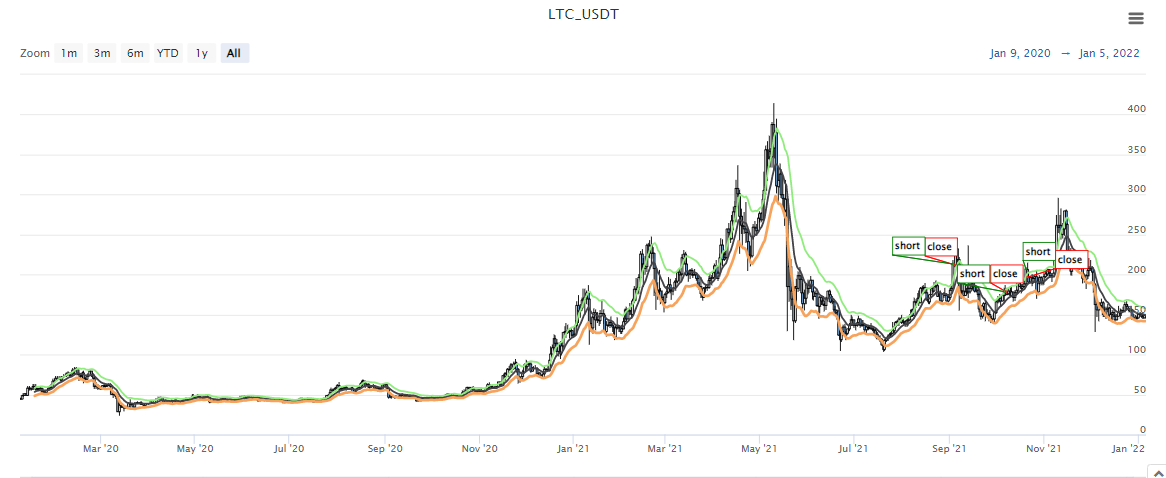
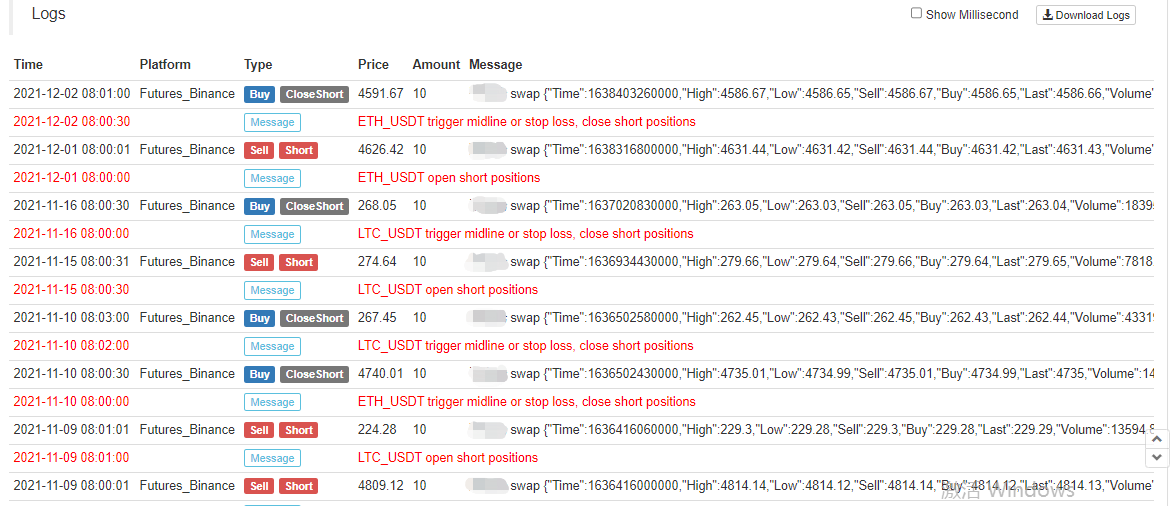
Strategy source code: https://www.fmz.com/strategy/339344
Strategies are for backtesting and learning research only. Please modify, optimize, and refer to the real bot by yourself.