This strategy was open-sourced by user @Gianbin, adapted from our earlier dual-route workflow trading framework. Thanks for the generous contribution — here’s a full breakdown of the strategy logic.
1. Core Concept: Contrarian Shorting of Pump Coins
In crypto, “pump coins” appear frequently — tokens that surge 30–40% or even 100%+ in a single day. They look tempting, but the harder they pump, the harder they tend to dump.
This strategy exploits exactly that:
- Screen the top gainers from Binance’s 24-hour leaderboard
- Use an AI multi-factor model to identify which ones have “topped out”
- Open short positions and wait for the pullback, profiting from overleveraged chasers
Capital management principle: Fixed 50 USDT per entry, total position capped at 500 USDT — relatively controlled risk.
2. Workflow Architecture Overview
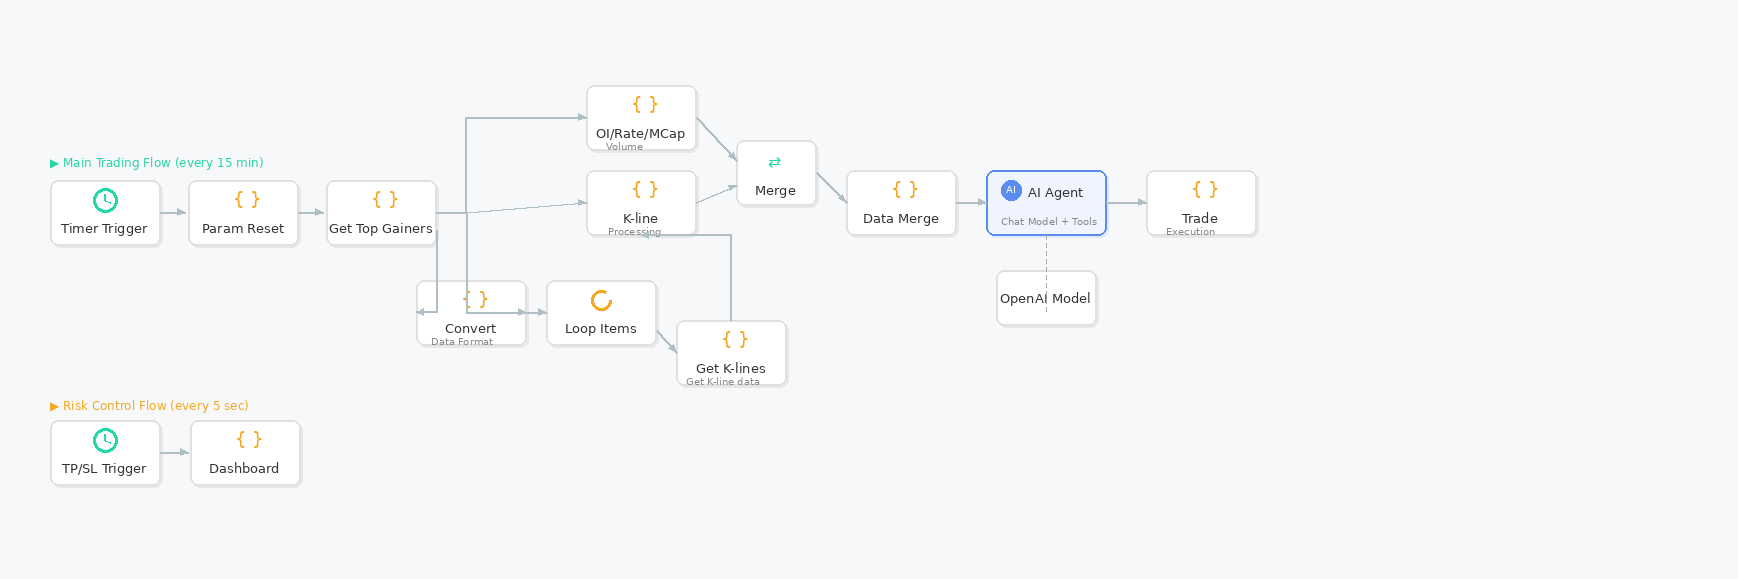
The strategy consists of two independent workflows, each with its own role:
- Main Trading Flow (every 15 min): Screen top gainers → Collect data → AI analysis → Execute entry
- Risk Control Flow (every 5 sec): Real-time monitoring → TP/SL detection → Inverse pyramid scaling → Visual dashboard
Strategy decisions can run at a relaxed pace, but risk control must react fast. That’s why the trigger frequencies differ so dramatically.
3. Main Trading Flow — Step by Step
Step 1: Screen Pump Coins from the Gainers List
A timer trigger fires every 15 minutes, pulling all USDT perpetual contract tickers from Binance. It filters for tokens with 24-hour gains exceeding 10% and takes the top 20. Tokens already in open positions are automatically excluded to prevent duplicate entries.
// Core screening logic (excerpt)
const minChange = $vars.minChange || 0.1; // Default gain threshold: 10%
const topN = $vars.topN;                  // Top N, default 20

// Filter USDT perpetuals, calculate 24h change
const change24h = open24h > 0 ? (price - open24h) / open24h : 0;
if (change24h < minChange) continue;      // Below threshold, skip

// Exclude tokens already in positions
if (excludeHolding && holdingSymbols.indexOf(symbol) !== -1) continue;

// Sort by gain descending, take top N
usdtPairs.sort((a, b) => b.change24h - a.change24h);
const topGainers = usdtPairs.slice(0, topN);
This step is essentially an “audition” — rounding up the hottest pump coins for further analysis.
Step 2: Multi-Dimensional Data Collection
Price gains alone aren’t enough. The system simultaneously collects the following data to feed the AI analysis:
| Data Dimension | Meaning | Purpose |
|---|---|---|
| Open Interest (OI) | Total contract market open positions | Measure liquidity and market hype |
| Funding Rate | Payment ratio between longs and shorts | Determine if shorts are already overcrowded |
| Market Cap (MCap) | Circulating market cap | Calculate OI/MCap leverage ratio |
| K-line Data | Daily OHLCV | Technical pattern analysis |
The OI/MCap ratio is the core metric — the higher this ratio, the more leveraged the market is, the greater the liquidation risk, and the better the odds for shorting.
// Fetching open interest via Binance API (excerpt)
const ret = exchange.IO("api", "GET", "/fapi/v1/openInterest", "symbol=" + symbol);
if (ret && ret.openInterest) {
    openInterest = parseFloat(ret.openInterest) * coin.price; // Convert to USD
}

// Calculate OI/MCap ratio
const oiMcapRatio = marketCap > 0 ? openInterest / marketCap : 0;
Market cap data is fetched from the CoinMarketCap API with a 30-minute local cache to avoid excessive external API calls.
Step 3: AI Six-Factor Scoring System
This is the heart of the strategy. After collecting data, everything is packaged and sent to an AI model (x-ai/grok-4.1-fast in this case) for scoring on a scale of 10. Only targets scoring 8.0 or above make it to the candidate entry list.
Six Factors and Weights
| Factor | Weight | Scoring Logic |
|---|---|---|
| OI/MCap Ratio | 3.5 | >35% = full score; higher leverage = more dangerous |
| K-line Pattern | 2.8 | Long upper shadows / high doji = topping signals score high |
| Open Interest | 1.5 | Better liquidity = higher score |
| Volume | 1.5 | More active trading = higher score |
| Price Gain | 0.5 | Already filtered initially, low differentiation |
| Funding Rate | 0.2 | More crowded longs = higher score |
OI/MCap ratio carries the highest weight (3.5) because it directly reflects market leverage — higher leverage means a reversal is more likely to trigger cascading liquidations, giving shorts better risk-reward.
K-line Pattern Scoring Rules
- Long upper shadow breaking new high (2.8 pts): High makes a new high, upper shadow > body × 2
- Long upper shadow at highs (2.4 pts): Upper shadow > body × 2, close near 24h high
- Bearish candle on high volume (2.0 pts): Closes red, volume > previous day × 1.5
- Doji at highs (1.8 pts): Body < range × 0.1, price near the high
- Two consecutive bearish candles (1.5 pts)
Hard Filters (Applied Before Scoring)
Before AI scoring, the strategy applies several hard filters — failing any one means the token is skipped entirely:
- Already in position → skip (prevent overconcentration)
- Funding rate < -0.20% → skip (shorts already overcrowded)
- Open interest < $30M → skip (insufficient liquidity)
- Weekly drawdown > 5% → skip (too far from high, may have already pulled back)
- Intraday drawdown > 5% → skip (already dropped from today’s high, no longer at peak)
// Weekly high calculation (excerpt)
const weeklyHigh = Math.max(...klines.slice(-7).map(k => k.high));
const weeklyDrawdown = (weeklyHigh - price) / weeklyHigh;
if (weeklyDrawdown > 0.05) { // More than 5% from weekly high, skip
    filtered.weeklyDrawdown++;
    continue;
}
Final Decision Logic
When total score ≥ 8.0 and intraday drawdown ≤ 5%, the decision logic kicks in: if funding rate ≥ -0.15%, output “open short”; if funding rate is between -0.20% and -0.15%, output “cautious short.” Targets scoring below 8.0 are not outputted and no positions are opened.
Step 4: Trade Execution
The AI outputs decisions in JSON format, and the trade execution node parses and places orders:
// Execute short (excerpt)
function executeShort(coin, signalInfo) {
    exchange.SetCurrency(coin + '_USDT');
    exchange.SetContractType("swap");
    exchange.SetMarginLevel(CONFIG.DEFAULT_LEVERAGE); // Set required leverage

    // Calculate contract size from fixed amount
    const contractAmount = calculateContractAmount(
        CONFIG.FIXED_AMOUNT_USD, // Fixed 50U
        currentPrice,
        market
    );

    exchange.SetDirection("sell");
    const orderId = exchange.Sell(-1, contractAmount); // Market short

    if (orderId) {
        _G(`${coin}_USDT.swap_maxprofit`, 0); // Initialize max profit tracker
        Log(`✅ ${coin}: Short opened, score ${signalInfo.score}`);
    }
}
Each entry uses a fixed 50 USDT — single-trade risk is well-contained.
4. Risk Control Flow — Detailed Breakdown
Triggers every 5 seconds, continuously monitoring all open positions with two core functions: inverse pyramid scaling and take-profit / stop-loss.
Inverse Pyramid Scaling
This is the most interesting design in the strategy. After opening a short, if the price rises instead of falling, most traders would stop out. But this strategy chooses to scale in against the trend — the higher it goes, the more it adds — because the higher the pump, the harder the eventual crash tends to be.
Scaling rules:
- Initial entry: 50U (entry price = P0)
- If price rises 50% from P0 → first add: 150U, record price as P1
- If price rises 70% from P1 → second add: 300U
- Maximum 2 additions, total position cap: 500U (50 + 150 + 300)
// Pyramid add detection (excerpt)
function checkAndExecutePyramidAdd(coin, entryPrice, currentPrice, isShort) {
    const addCount = _G(addCountKey) || 0;
    if (addCount >= 2) return null; // Max 2 additions

    if (addCount === 0) {
        // First add: triggered at 50% above entry
        triggerPrice = storedEntryPrice * (1 + PYRAMID_CONFIG.ADD1_TRIGGER);
        addAmount = PYRAMID_CONFIG.ADD1_AMOUNT; // 150U
    } else if (addCount === 1) {
        // Second add: triggered at 70% above first add price
        triggerPrice = add1Price * (1 + PYRAMID_CONFIG.ADD2_TRIGGER);
        addAmount = PYRAMID_CONFIG.ADD2_AMOUNT; // 300U
    }

    if (currentPrice >= triggerPrice) {
        return {
            level: addCount + 1,
            amount: addAmount,
            triggerPrice,
            currentPrice
        };
    }
    return null;
}
The logic behind this design: The more a pump coin surges, the more frenzied the speculation, and the bigger the bubble. When the reversal finally hits, high leverage triggers cascading liquidations that amplify the crash. Holding a larger position at higher prices means profits multiply when the reversal comes.
The risk is equally obvious: If the token genuinely keeps rising without looking back (e.g., a real bull market or major fundamental catalyst), losses scale up too. Therefore, the account should hold sufficient funds to withstand volatility and avoid forced liquidation. The strategy explicitly caps total position at 500U to prevent unlimited scaling.
Take-Profit / Stop-Loss Mechanism
Take-profit uses a trailing drawdown model rather than a fixed target:
- When max unrealized profit reaches 35%, drawdown monitoring activates automatically
- Once profit pulls back 5% from its peak, the position is closed immediately
This design “lets profits run” — it won’t exit too early and miss bigger gains, but also won’t ride the elevator back down and give it all back.
// Auto take-profit trigger logic (excerpt)
if (enableAutoTpDrawdown && isShort && tpDrawdown === 0
    && maxPnlPercent >= autoTpTrigger) {
    tpDrawdown = autoTpDrawdownValue; // Set 5% trailing TP
    _G(tpDrawdownKey, tpDrawdown);
    Log(`🎯 ${coin} max P&L reached ${maxPnlPercent}%, enabling 5% trailing TP`);
}

// Trigger take-profit
if (tpDrawdown > 0 && maxPnlPercent > 0 && drawdown >= tpDrawdown) {
    autoCloseReason = `Trailing TP (drawdown ${drawdown}% ≥ ${tpDrawdown}%)`;
}
For stop-loss, the strategy supports manually setting a fixed percentage stop-loss as a hard floor of protection.
5. Visual Dashboard
The strategy includes four built-in monitoring panels for real-time operational awareness:
- Account Overview: Equity, cumulative P&L, profit rate, account leverage (with color-coded risk levels)
- AI Signal Table: Records every AI decision’s score, conclusion, per-factor scores and reasoning — no guessing what the AI is thinking
- Position Monitor: Real-time display of each position’s entry price, current price, unrealized P&L, max profit record, current drawdown, scaling trigger prices, and TP/SL status
- Grid Details: Order status when positions are combined with grid trading
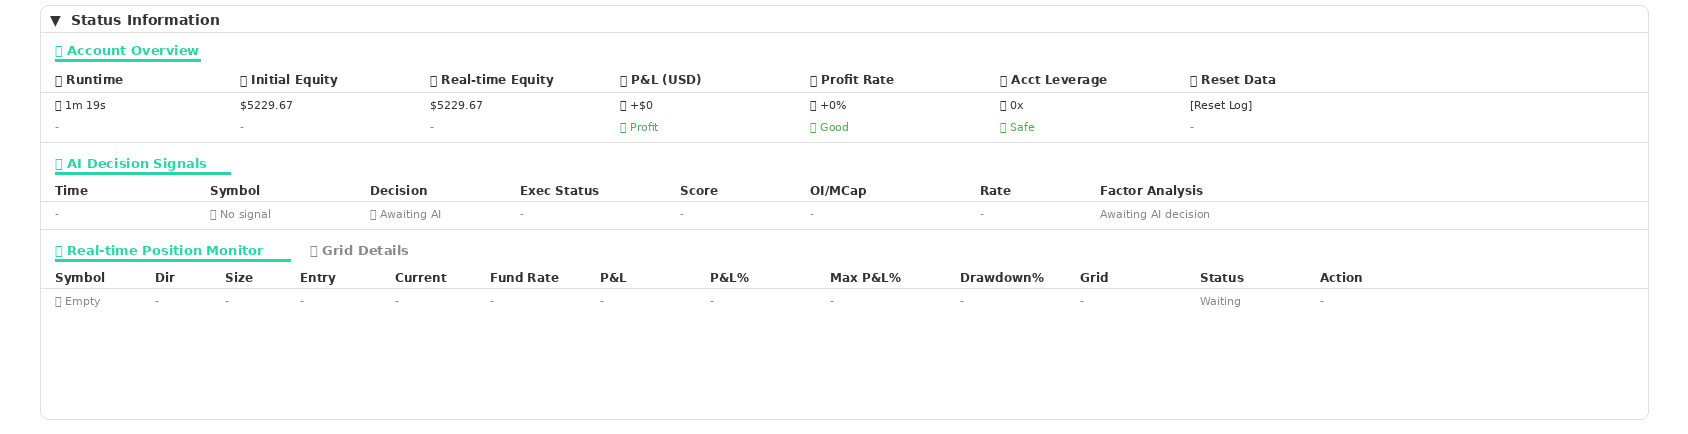
Refreshes every 5 seconds, rendered as interactive tables via FMZ’s LogStatus, supporting direct actions like closing positions and modifying TP/SL parameters.
6. Objective Pros & Cons Assessment
Strengths
- Contrarian approach with natural counterparties. Shorting while the market chases means ample liquidity and minimal slippage.
- AI multi-factor screening — not blind shorting. Six dimensions of comprehensive scoring filter out most low-quality signals. Only targets scoring 8+ get traded.
- Inverse pyramid + trailing TP = solid risk-reward. Adding more at higher prices means bigger profits on reversal; flexible TP lets profits fully develop.
- Strict position control. 500U max per trade — even a total loss is within tolerance.
Risks & Limitations
- Sustained losses in a one-sided bull market. If the market enters a strong uptrend, shorting the top gainers can mean consecutive losses.
- Inverse pyramid scaling is a double-edged sword. Scaling against the trend amplifies winning trades, but equally amplifies losing ones. If a pump coin genuinely keeps rising (e.g., a project with a major fundamental catalyst), all three position layers take losses — maximum exposure is 500U.
- Best suited for: Ranging or bearish environments. Not suitable for one-sided bull markets. Assess the broader market context before deploying.
7. Final Thoughts
The core philosophy of this strategy: replace subjective judgment with data and AI, replace wishful thinking with strict position control.
Whether it’s the design of the six-factor scoring system or the choice of OI/MCap ratio as the core metric, you can see the author has a solid understanding of market microstructure — knowing which indicators truly matter and which are just noise.
That said, every strategy has its boundaries. Tools are static; markets are dynamic. We strongly recommend thorough backtesting before going live, adjusting parameters to your own risk tolerance, and never copying blindly.
Special thanks to user @Gianbin for sharing this strategy so openly. It’s this kind of open-source spirit that gives more people the opportunity to learn and explore the possibilities of quantitative trading. If you have great strategy ideas of your own, we’d love to hear about them!