In the previous article, we implemented a simple hedging strategy together, and then we will learn how to upgrade this strategy.
The strategy changes are not big, but the details of the changes need attention. The definitions of some places in the code have changed from the previous ones, which need to be understood.
The need to upgrade this strategy
- Switching spot exchange object leverage mode
This change is only related to the real bot. Some spot exchanges have spot leverage interfaces, which are also encapsulated on FMZ. For exchange objects that have been directly packaged on FMZ and support spot leverage, the mode can be switched directly. - Add spread chart display
Add spread chart display, because it’s just drawing the spread line ofA exchange -> B exchange,B exchange -> A exchange, and drawing the horizontal line that triggers the spread. We use theline drawing class libraryto deal with directly, the advantage is that it is easy to use, here we also learn how to use thetemplate class libraryfunction of FMZ. - One-sided hedging function
This change can be quite significant, because it is difficult to completely reverse the price difference between the two exchanges during specific hedging transactions. Most of the time the price on one exchange is consistently higher than the price on another exchange. At this time, if our assets have been fully hedged (that is, the coins are all on exchanges with low prices, and the money is on exchanges with high prices). The hedging is stagnant, and it is no longer possible to rely on the fluctuation of the spread to make a profit. At this time, we need to make the strategy so that you can lose a little money to hedge the coins back (let the coins exist on the exchange with high price again), and when the price difference becomes larger again, we can continue to hedge and earn profit. - Interactively modify parameters such as hedging spread lines
Add interactive function to the strategy to modify the spread trigger line in real time. - Organize status bar information and display it in a table format
Arrange the data that needs to be displayed for easy viewing.
Next, let’s implement these designs one by one.
Switch spot exchange object leverage mode
Take Binance spot real bot as an example, switch to spot leveraged mode, use the code exchanges[i].IO, input the parameter trade_normal to switch to leverage position by position, and input trade_super_margin to switch to leverage full position, backtesting is not supported. This is only used in real bot.
Add to the preparation phase at the beginning of the main function:
    // Switch leverage mode
    for (var i = 0 ; i < exchanges.length ; i++) {   // Traverse and detect all added exchange objects
        if (exchanges[i].GetName() == "Binance" && marginType != 0) {   //If the exchange object represented by the current i-index is Binance spot, and the parameter marginType of the strategy interface is not the option of "common currency", execute the switch operation
            if (marginType == 1) {
                Log(exchanges[i].GetName(), "Set to leveraged position-by-position")
                exchanges[i].IO("trade_normal")
            } else if (marginType == 2) {
                Log(exchanges[i].GetName(), "Set to leveraged full position")
                exchanges[i].IO("trade_super_margin")
            }
        }
    }
The strategy here only adds the code for switching the coin-to-coin leverage mode of Binance spot, so the switch setting on the strategy parameters is only valid for Binance spot.
Added spread chart display
Using the encapsulated plotting templates is very simple. The template name we use here is chart plot Library. You can directly search for it in the Square of FMZ platform .
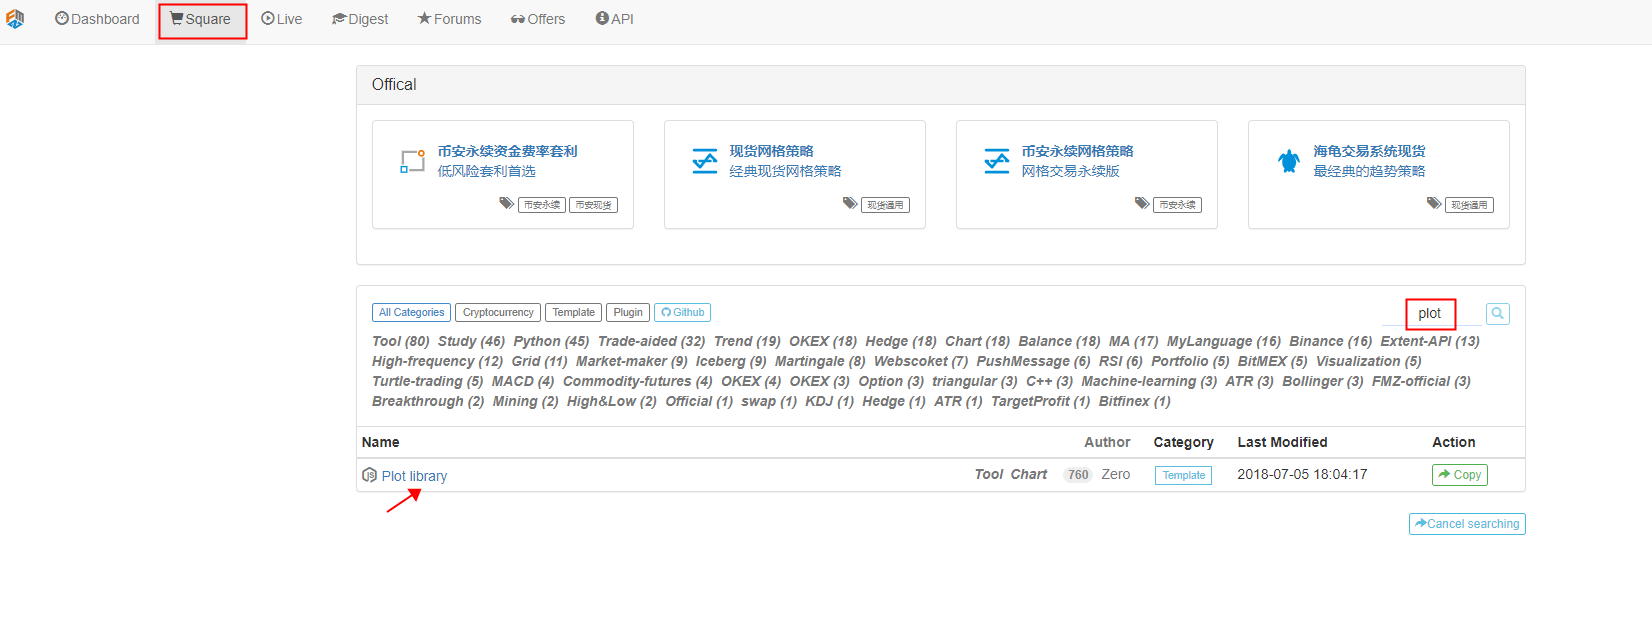
Or you can directly click the link: https://www.fmz.com/strategy/27293 to skip to the copy page of the template.
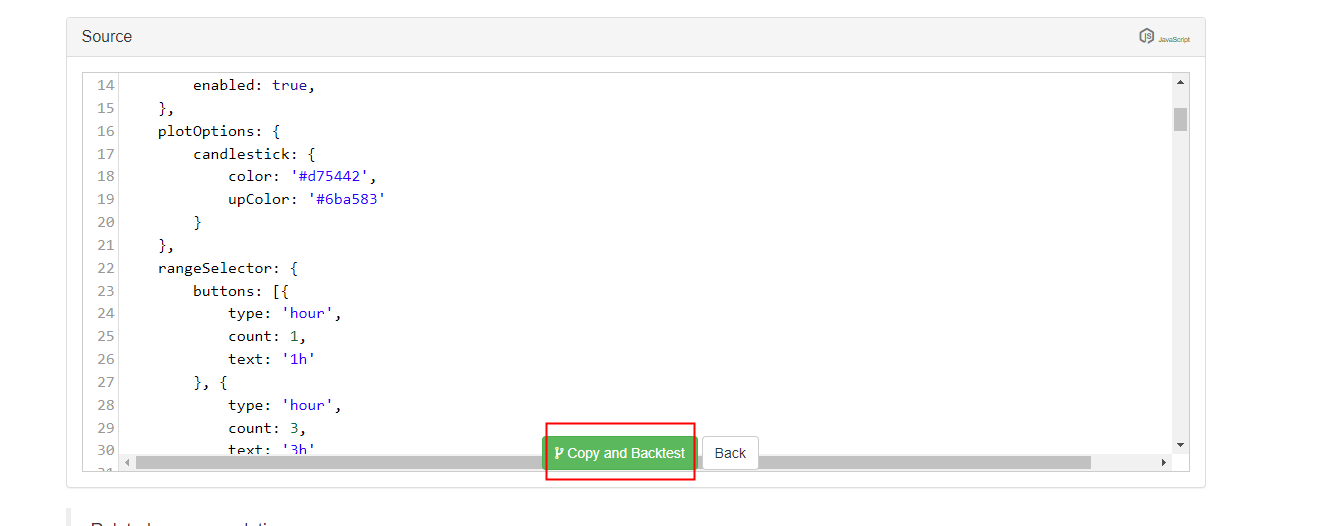
Click the button and you can easily copy the template to your own strategy library.
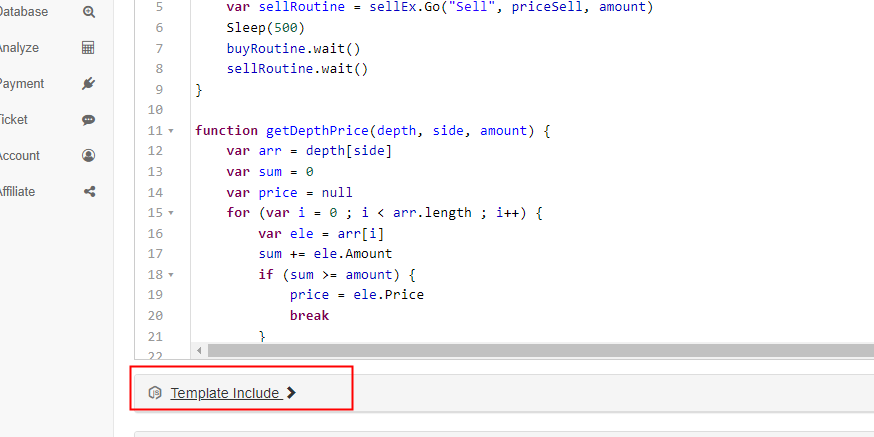
Then, on the strategy editing page, you can check the template library to be used in the template column. Save the strategy after checking it, and the strategy will use this template. This is just a brief description of the use of the template library. Since the strategy has already referenced this template, there is no need to repeat the operation. When you copy the strategy code in Square, you can see that chart plot Library has been referenced in the template bar of the strategy editing page.
Here we mainly learn how to use the functions of the chart plot library to plot.
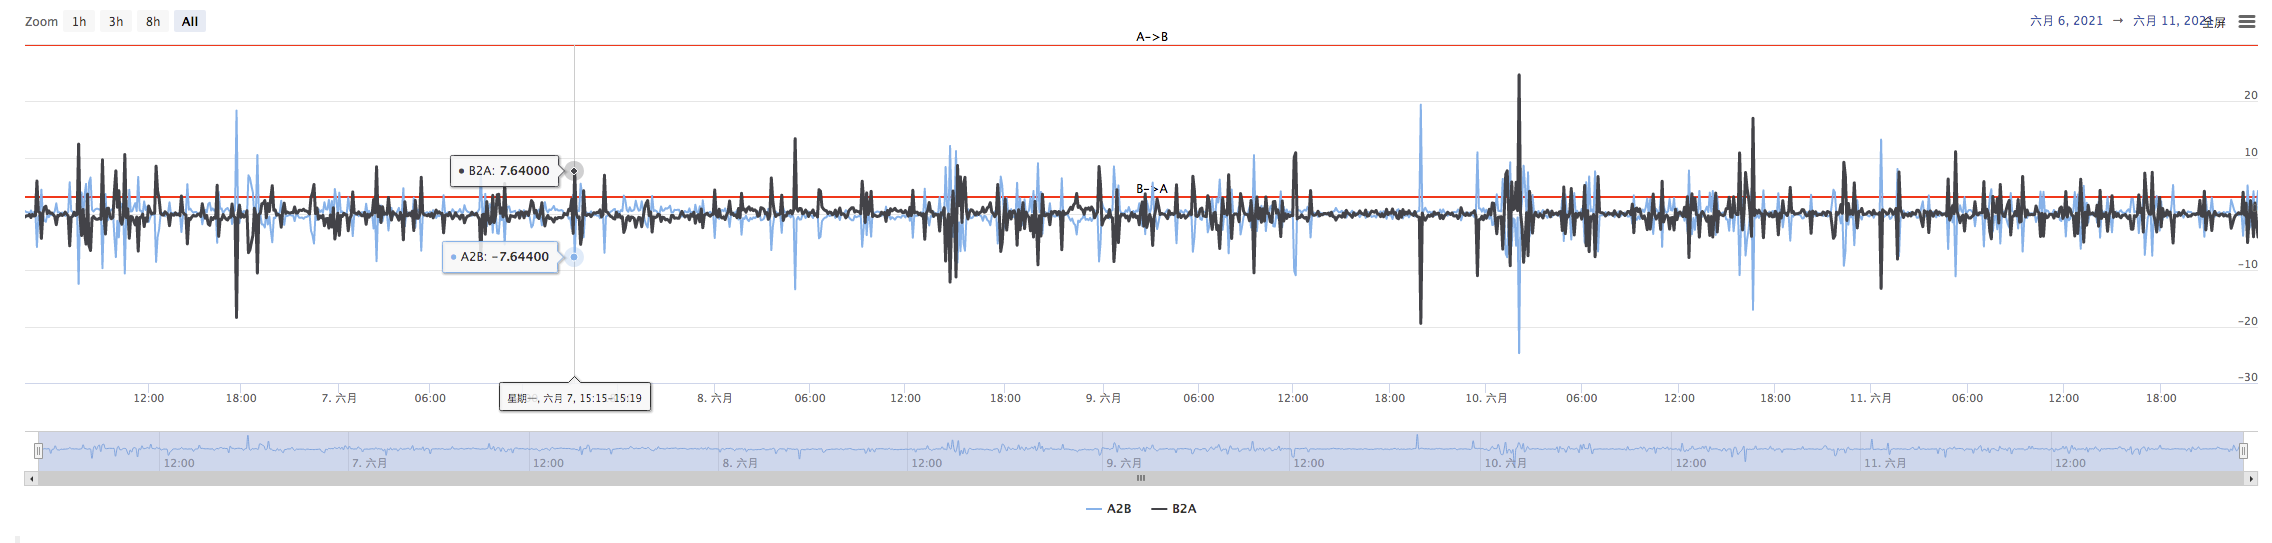
We plan to plot the spreads of A->B and B->A, and the trigger line of the spread. We need to plot two curves (currently, the spreads of A to B and B to A), and two horizontal lines (spread trigger lines), as shown in the figure above.
Because we want to design a single sided hedge, the trigger lines of A->B and B->A will be different, and we can not use the design in the previous article.
In the previous article:
      var targetDiffPrice = hedgeDiffPrice
      if (diffAsPercentage) {
          targetDiffPrice = (depthA.Bids[0].Price + depthB.Asks[0].Price + depthB.Bids[0].Price + depthA.Asks[0].Price) / 4 * hedgeDiffPercentage
      }
There is only one triggered spread targetDiffPrice.
Therefore, here we need to modify the code, and we need to modify the parameters first.
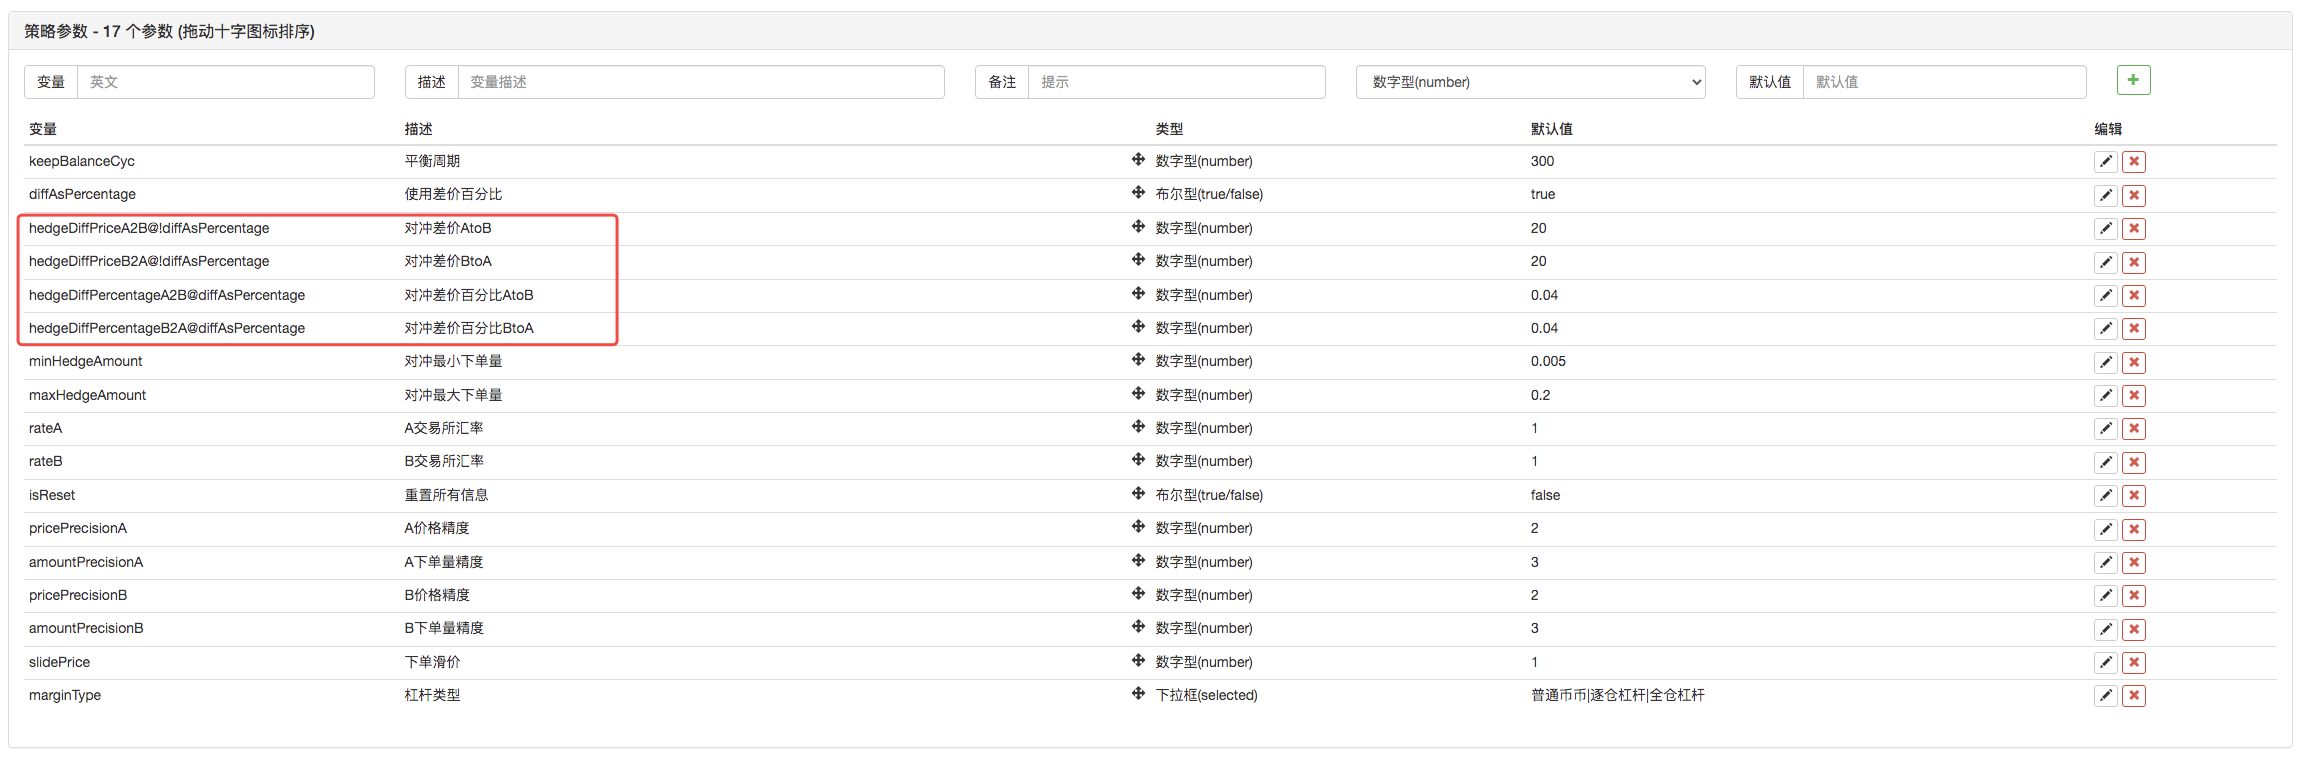
then, modify the code:
        var targetDiffPriceA2B = hedgeDiffPriceA2B
        var targetDiffPriceB2A = hedgeDiffPriceB2A
        if (diffAsPercentage) {
            targetDiffPriceA2B = (depthA.Bids[0].Price + depthB.Asks[0].Price + depthB.Bids[0].Price + depthA.Asks[0].Price) / 4 * hedgeDiffPercentageA2B
            targetDiffPriceB2A = (depthA.Bids[0].Price + depthB.Asks[0].Price + depthB.Bids[0].Price + depthA.Asks[0].Price) / 4 * hedgeDiffPercentageB2A
        }
Thus, the spread trigger line has changed from the previous one targetDiffPrice to two, namely targetDiffPriceA2B and targetDiffPriceB2A.
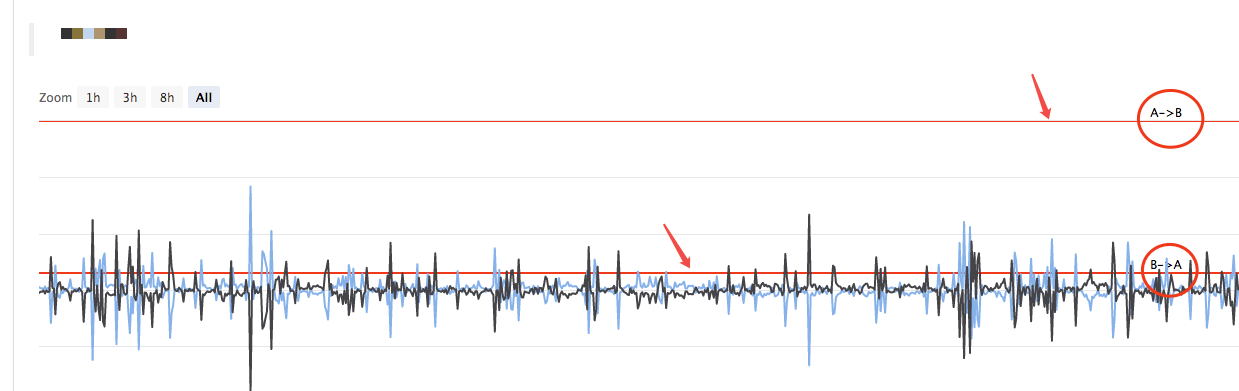
Next, you can use the chart plotting function of the chart plot library to draw the data on the chart.
        // plot
        $.PlotHLine(targetDiffPriceA2B, "A->B")  // the first parameter of the function is the value of the horizontal line in the Y-axis direction, and the second parameter is the display text
        $.PlotHLine(targetDiffPriceB2A, "B->A")
When the strategy is run, the chart will be displayed like this.
Next, draw the real-time spread curve; in order to avoid over drawing, put the code that plots the real-time spread curves in the balance detection.
s
        if (ts - lastKeepBalanceTS > keepBalanceCyc * 1000) {
            nowAccs = _C(updateAccs, exchanges)
            var isBalance = keepBalance(initAccs, nowAccs, [depthA, depthB])
            cancelAll()
            if (isBalance) {
                lastKeepBalanceTS = ts
                if (isTrade) {
                    var nowBalance = _.reduce(nowAccs, function(sumBalance, acc) {return sumBalance + acc.Balance}, 0)
                    var initBalance = _.reduce(initAccs, function(sumBalance, acc) {return sumBalance + acc.Balance}, 0)
                    LogProfit(nowBalance - initBalance, nowBalance, initBalance, nowAccs)
                    isTrade = false
                }
            }

            $.PlotLine("A2B", depthA.Bids[0].Price - depthB.Asks[0].Price)  // plot real-time spread curves
            $.PlotLine("B2A", depthB.Bids[0].Price - depthA.Asks[0].Price)  // the first parameter is the curve name, and the second parameter is the curve value at the current moment, that is, the value in the Y-axis direction at the current moment
        }
The plotting code only needs 4 lines to allow the strategy with a chart display during runing.
Function of Single Sided Hedge
As mentioned above, the number of the spread trigger line has been changed into two, which respectively control the hedge trigger of A->B and B->A. In this way, the previous order price algorithm cannot be used, and the method of adding slide price to the market price is used instead.
if (depthA.Bids[0].Price - depthB.Asks[0].Price > targetDiffPriceA2B && Math.min(depthA.Bids[0].Amount, depthB.Asks[0].Amount) >= minHedgeAmount) { // A->B market condition satisfied
var priceSell = depthA.Bids[0].Price - slidePrice
var priceBuy = depthB.Asks[0].Price + slidePrice
var amount = Math.min(depthA.Bids[0].Amount, depthB.Asks[0].Amount)
if (nowAccs[0].Stocks > minHedgeAmount && nowAccs[1].Balance * 0.8 / priceSell > minHedgeAmount) {
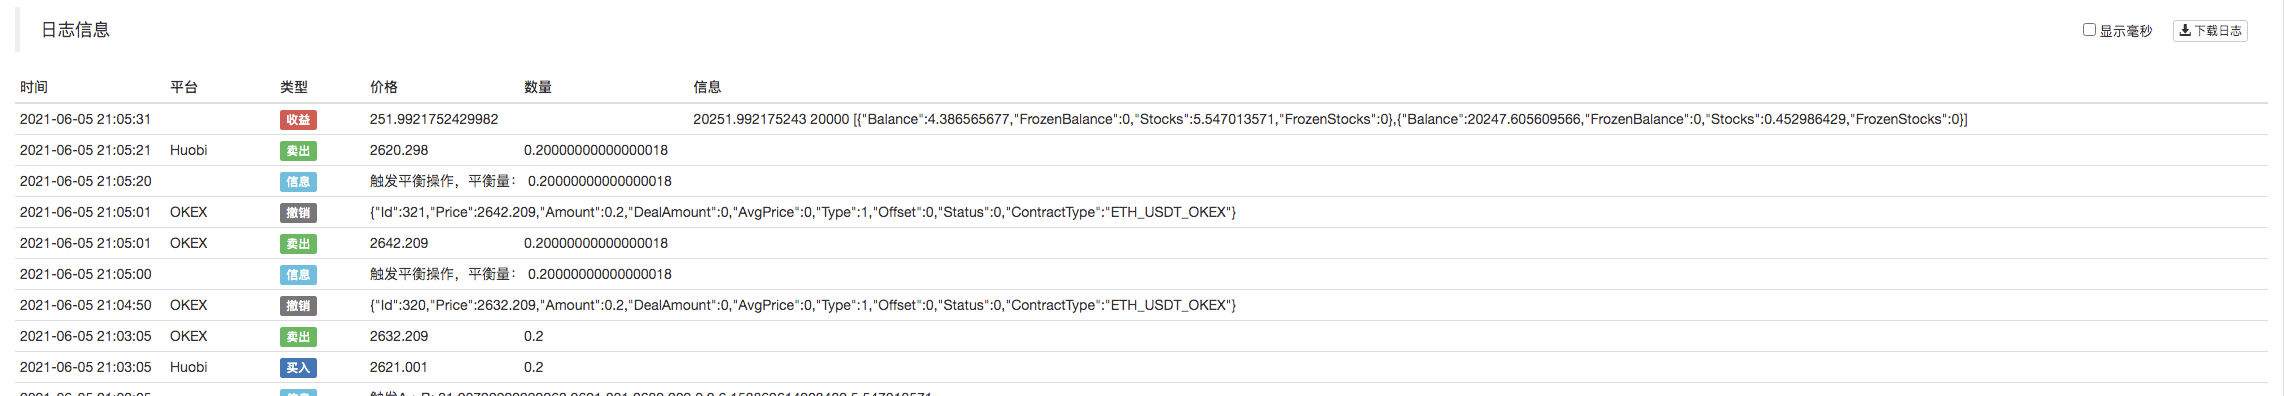
amount = Math.min(amount, nowAccs[0].Stocks, nowAccs[1].Balance * 0.8 / priceSell, maxHedgeAmount)
Log("triggerA->B:", depthA.Bids[0].Price - depthB.Asks[0].Price, priceBuy, priceSell, amount, nowAccs[1].Balance * 0.8 / priceSell, nowAccs[0].Stocks) // prompt message
hedge(exB, exA, priceBuy, priceSell, amount)
cancelAll()
lastKeepBalanceTS = 0
isTrade = true
}
} else if (depthB.Bids[0].Price - depthA.Asks[0].Price > targetDiffPriceB2A && Math.min(depthB.Bids[0].Amount, depthA.Asks[0].Amount) >= minHedgeAmount) { // B->A market condition satisfied
var priceBuy = depthA.Asks[0].Price + slidePrice
var priceSell = depthB.Bids[0].Price - slidePrice
var amount = Math.min(depthB.Bids[0].Amount, depthA.Asks[0].Amount)
if (nowAccs[1].Stocks > minHedgeAmount && nowAccs[0].Balance * 0.8 / priceBuy > minHedgeAmount) {
amount = Math.min(amount, nowAccs[1].Stocks, nowAccs[0].Balance * 0.8 / priceBuy, maxHedgeAmount)
Log("triggerB->A:", depthB.Bids[0].Price - depthA.Asks[0].Price, priceBuy, priceSell, amount, nowAccs[0].Balance * 0.8 / priceBuy, nowAccs[1].Stocks) // prompt message
hedge(exA, exB, priceBuy, priceSell, amount)
cancelAll()
lastKeepBalanceTS = 0
isTrade = true
}
}
Since buy and sell prices are split into two pieces of data, the hedge function also needs to be modified.
function hedge(buyEx, sellEx, priceBuy, priceSell, amount) {
    var buyRoutine = buyEx.Go("Buy", priceBuy, amount)
    var sellRoutine = sellEx.Go("Sell", priceSell, amount)
    Sleep(500)
    buyRoutine.wait()
    sellRoutine.wait()
}
There are also some minor adjustments based on these modifications, which will not be described here. You can look at the code for details.
Interactively modify parameters like hedge spread line
Add interaction to the strategy, so that the strategy can modify the spread trigger line in real time. That is also the design requirement of a semi-automatic strategy, which will also be implemented here as a teaching demo.
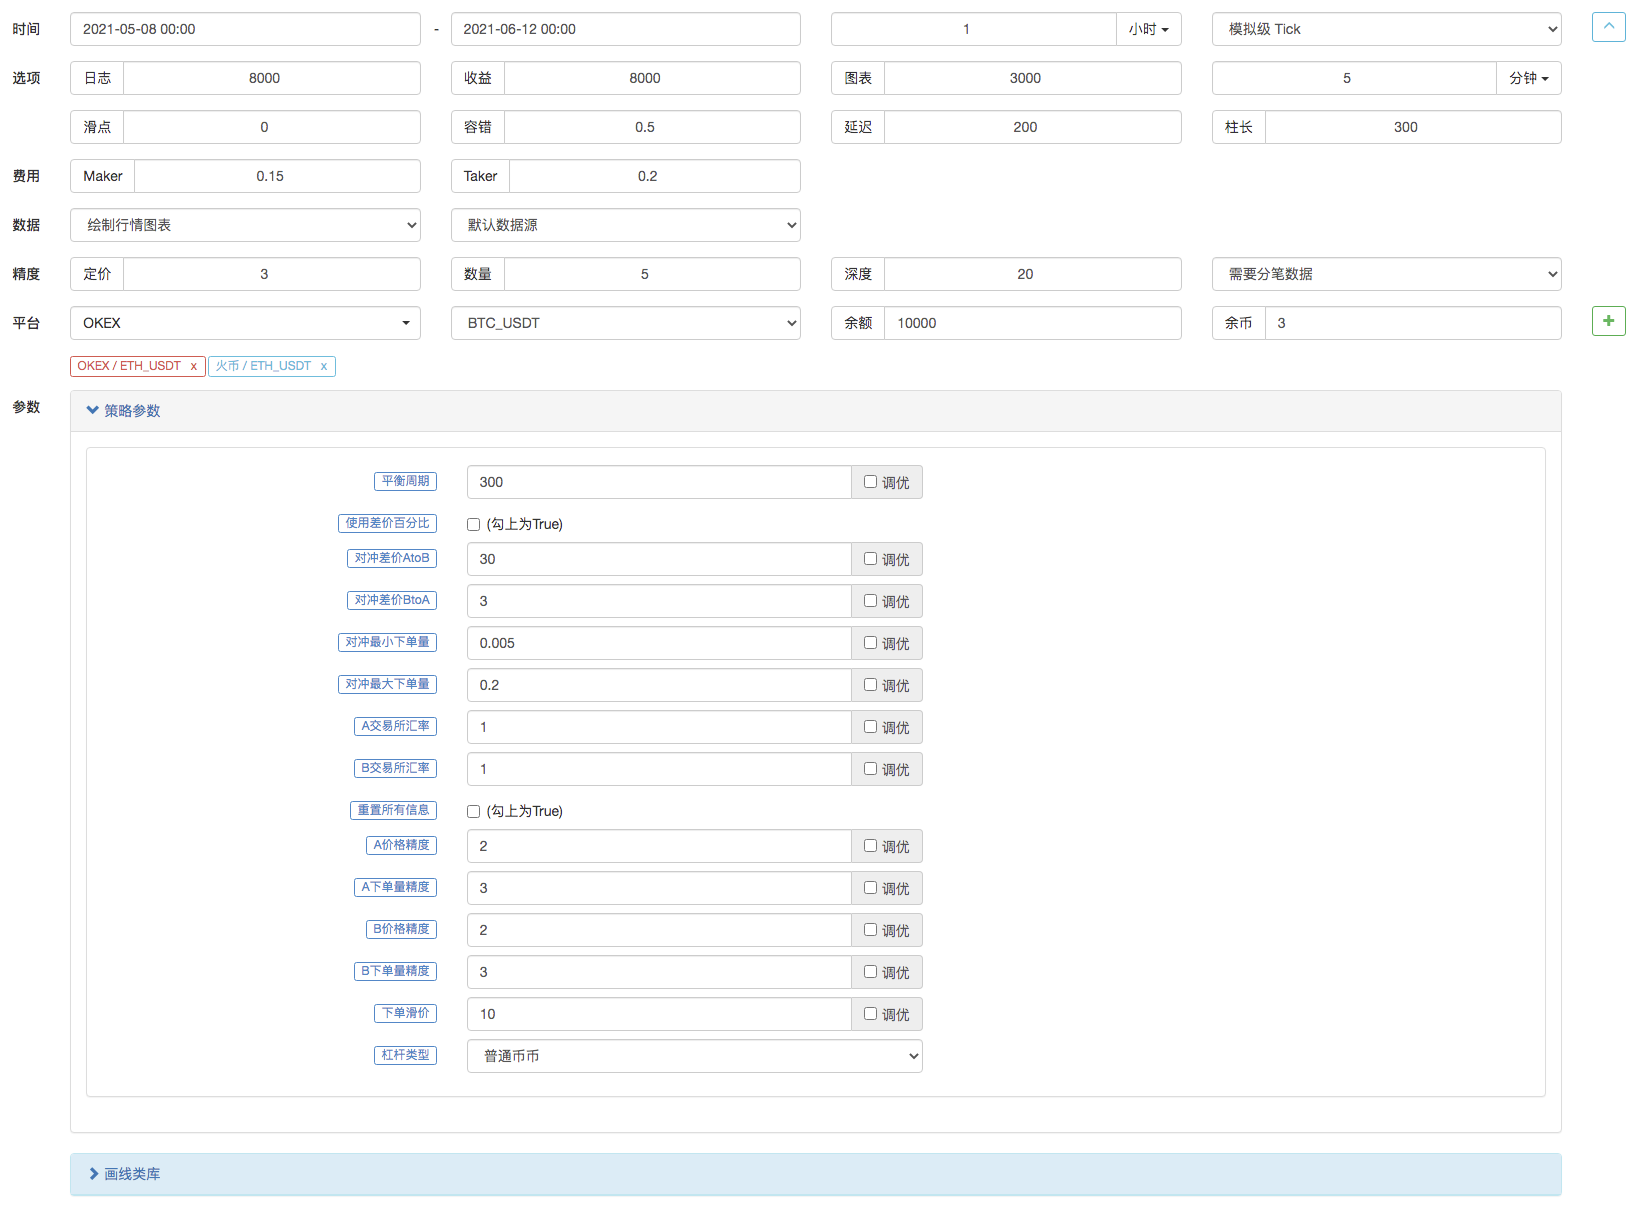
The strategy interaction design is also very simple. First, add interactive controls to the strategy on the strategy editing page.
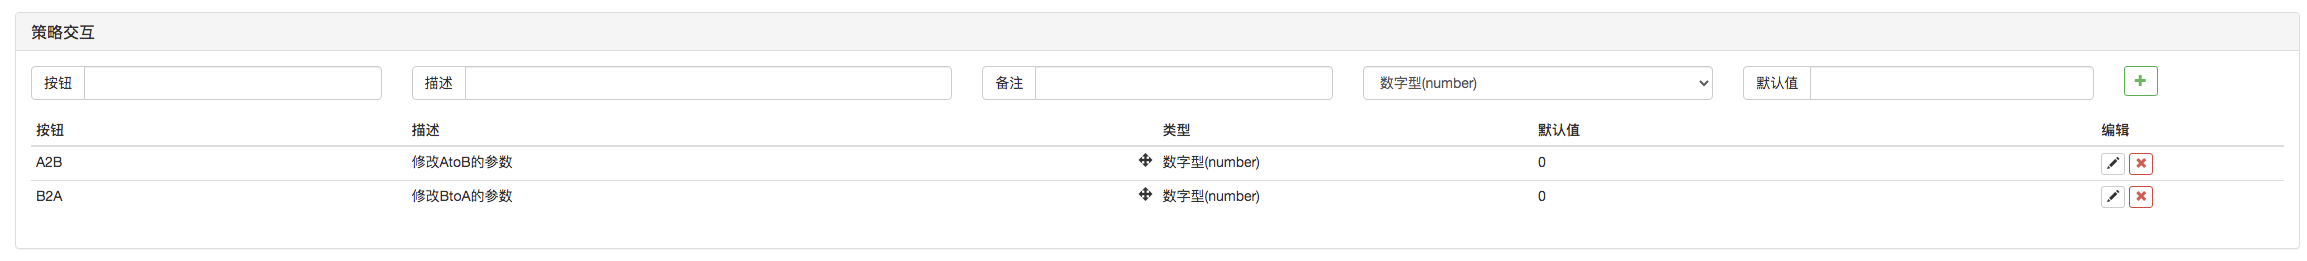
There were two controls added, one called A2B and the other one called B2A. After entering a value in the control input box, click the button on the right of the input box. A command will be sent to the strategy immediately, for example: enter the value 123 in the input box, click the A2B button, and a command will be sent to the strategy immediately.
A2B:123
Design interactive detection and processing code in the strategy code.
        // interaction
        var cmd = GetCommand()   // every time when the loop is operated here, it will detect whether an interactive command is sent; if no, return null string
        if (cmd) {               // interactive command detected, such as A2B:123
            Log("received command:", cmd)
            var arr = cmd.split(":")   // split out the interactive control name and the value in the input box; arr[0] means A2B, and arr[1] means 123
            if (arr[0] == "A2B") {     // judge whether the triggered interactive control is A2B
                Log("modify parameterA2B,", diffAsPercentage ? "parameter of spread ratio:" : "parameter of spread:", arr[1])
                if (diffAsPercentage) {
                    hedgeDiffPercentageB2A = parseFloat(arr[1])     // modify the spread trigger line
                } else {
                    hedgeDiffPriceA2B = parseFloat(arr[1])          // modify the spread trigger line
                }
            } else if (arr[0] == "B2A") {           // detected the triggered control is B2A
                Log("modify parameterB2A,", diffAsPercentage ? "parameter of spread ratio:" : "parameter of spread:", arr[1])
                if (diffAsPercentage) {
                    hedgeDiffPercentageA2B = parseFloat(arr[1])
                } else {
                    hedgeDiffPriceB2A = parseFloat(arr[1])
                }
            }
        }
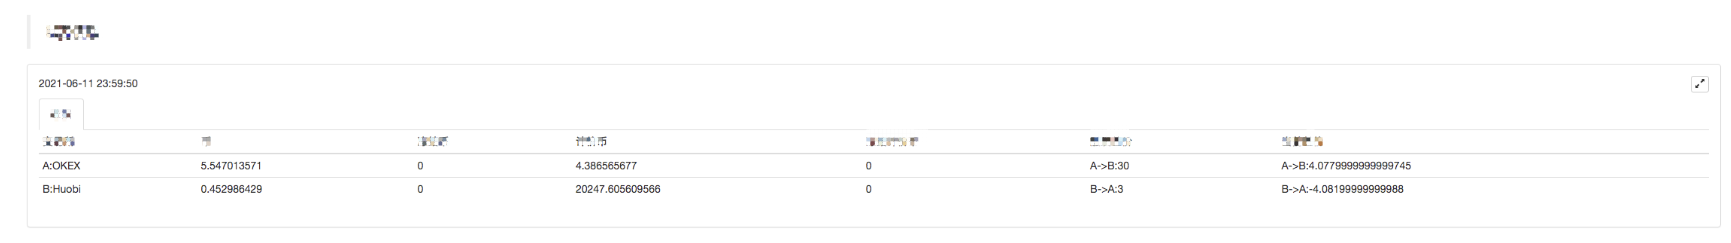
Manage the status bar information and display it in the table format
Make the status bar data display more regulated and easy to observe.
        var tbl = {
            "type" : "table",
            "title" : "data",
            "cols" : ["platform", "Currency", "frozenCurrrency", "quoteCurrency", "frozenQuoteCurrency", "triggerSpread", "currentSpread"],
            "rows" : [],
        }
        tbl.rows.push(["A:" + exA.GetName(), nowAccs[0].Stocks, nowAccs[0].FrozenStocks, nowAccs[0].Balance, nowAccs[0].FrozenBalance, "A->B:" + targetDiffPriceA2B, "A->B:" + (depthA.Bids[0].Price - depthB.Asks[0].Price)])
        tbl.rows.push(["B:" + exB.GetName(), nowAccs[1].Stocks, nowAccs[1].FrozenStocks, nowAccs[1].Balance, nowAccs[1].FrozenBalance, "B->A:" + targetDiffPriceB2A, "B->A:" + (depthB.Bids[0].Price - depthA.Asks[0].Price)])

        LogStatus(_D(), "\n", "`" + JSON.stringify(tbl) + "`")
Backtest
The backtest is only a test of the strategy, as a preliminary detection function. Many bugs can actually be tested in the backtest stage. It is not necessary to care too much about the backtest results. Eventually, the strategy still needs to be tested in the actual environment with real bots.
Strategy source code: https://www.fmz.com/strategy/302834