
Strategy Background
Earlier this year, stories about someone making a fortune overnight on Polymarket were circulating widely across communities. Curious about the actual trading framework behind it, I went digging—only to find nothing but clickbait headlines without a single line of code. So I had no choice but to build one myself.
Honestly, I had no clue where to start. Polymarket is currently the largest decentralized prediction market platform, with over 60,000 listed markets covering politics, sports, macroeconomics, and virtually every forecastable event. Each market is essentially a binary options contract—if the outcome occurs, the price converges to 1; if not, it goes to zero. The most profitable edge? Insider information, obviously. But regular people don’t know how many tweets Elon will post next week, don’t know whether the Fed will cut rates next time, and certainly don’t have the time or energy to monitor markets, analyze data, and make decisions around the clock.
So I thought: what if we flip the approach—instead of chasing information, chase the money. Those with an information edge will position themselves early, and their buying activity inevitably leaves traces in price and volume data. Even without knowing the “inside story,” you can infer whether someone is quietly building a position by observing capital behavior. Following this logic, I built a multi-role AI-powered analysis and trading system that strings together K-line signal detection, news verification, AI-driven judgment, and automated order execution with risk controls into a single end-to-end pipeline.

System Architecture
The entire system runs on FMZ Quant’s workflow engine, split into two parallel scheduling paths—a main line and a secondary line—fully decoupled and non-blocking.
| Scheduling Path | Trigger Frequency | Responsible Modules | Core Task |
|---|---|---|---|
| Main Trading Line | Every 10 minutes | Screening → Loop Processing → AI Agents → Trade Execution | Finding opportunities, opening positions |
| Secondary Trading Line | Every 30 seconds | Stop-loss/Take-profit | Position monitoring, trailing stop, expiry redemption |
The main line handles “finding opportunities and opening positions.” Each cycle consists of four sequential stages: initial screening → K-line anomaly detection → news search → multi-role AI analysis, ultimately producing a buy signal that feeds into order execution. The secondary line only manages “existing positions,” running continuously on a 30-second cycle regardless of whether the main line has any in-flight tasks.
This separation addresses a practical problem: prediction market prices move continuously, but stock-picking analysis is computationally intensive and high-latency. If stop-loss monitoring were crammed into the main line, stop-loss response would severely lag whenever AI analysis runs slow. Independent scheduling is a necessary engineering trade-off.
Module Deep Dive
Initial Screening: Filtering Out the Noise
With 60,000 markets, analyzing each one individually is impossible. The first gate is pure rule-based filtering with a single objective: rapidly eliminate obviously unworthy candidates and reserve downstream computational resources for truly valuable targets.
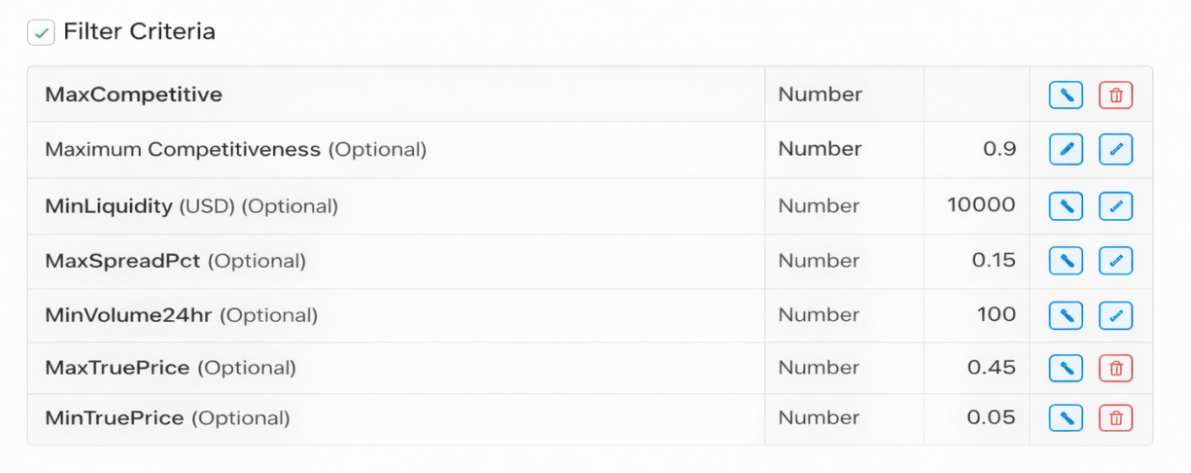
Screening criteria include: minimum liquidity (too low means trading difficulty), minimum 24-hour volume (markets with virtually no trading lack reference value), maximum bid-ask spread (excessive spread means high slippage costs), maximum competition, and a price range—only markets with implied probabilities between 5% and 50% are considered. Anything too high is already fully priced in with limited upside; anything too low is questionable in credibility, closer to lottery tickets than arbitrage opportunities.
After filtering, the same event typically has both Yes and No directions listed simultaneously. The strategy keeps only the lower-priced side, because the low-price end offers greater odds elasticity and higher potential returns.
let truePrice = parseFloat(outcomePrices[outcomeIndex] || 0)
if (truePrice < CONFIG.MIN_TRUE_PRICE || truePrice > CONFIG.MAX_TRUE_PRICE) continue

let isActive = (
    info.active === true &&
    info.approved === true &&
    info.closed === false &&
    info.archived === false &&
    info.acceptingOrders === true &&
    info.pendingDeployment === false
)
if (!isActive) continue

let spreadPct = (ask - bid) / ask
if (spreadPct > CONFIG.MAX_SPREAD_PCT) continue

// For the same event, keep only the lower-priced direction
if (!marketMap[baseSymbol]) {
    marketMap[baseSymbol] = entry
} else if (truePrice < marketMap[baseSymbol].price) {
    marketMap[baseSymbol] = entry
}
All screening thresholds are exposed as external parameters via $vars, allowing free adjustment based on your own risk appetite and capital size without modifying code.
K-Line Anomaly Detection: Finding Traces Left by Capital
After rough filtering, the system pulls 240 recent candlesticks at the 60-minute level for each passing market and runs five categories of anomaly detection. This is the strategy’s core signal layer, and the fundamental difference between this system and “just throwing an event to AI for analysis”—we don’t guess event outcomes; we look for capital behavior.
Slow Climb: Total gain exceeds 5% over the past 120 bars, but the maximum single-bar gain stays below 1.5%. This pattern describes capital deliberately suppressing pace to avoid drawing attention—a stealth accumulation posture.
Linear Volume Growth: Linear regression on the most recent 60 bars’ volume series yields a positive slope with R² above 0.5, indicating volume is expanding steadily and consistently rather than in random bursts. R² is the key filter—it screens out those “one massive spike then silence” noise patterns.
Pullback Narrowing: Tracks the maximum depth of each pullback from historical highs. If recent average pullback depth falls below 60% of early-period pullbacks, it indicates selling pressure is declining and chips are stabilizing—someone is absorbing supply. Each pullback’s lowest price is tracked throughout, using the complete pullback depth for calculation.
Consolidation Breakout: MA60 and MA120 divergence is less than 2% (consolidation state) while the current price exceeds MA60 by more than 3%, indicating a breakout above prior resistance.
Volume Surge: Recent 5-bar average volume exceeds the 60-bar baseline volume by more than 2.5x, indicating accelerating capital inflow.
function linearRegression(values) {
    let n = values.length
    let sumX = 0, sumY = 0, sumXY = 0, sumX2 = 0
    for (let i = 0; i < n; i++) {
        sumX += i; sumY += values[i]
        sumXY += i * values[i]; sumX2 += i * i
    }
    let slope = (n * sumXY - sumX * sumY) / (n * sumX2 - sumX * sumX)
    let intercept = (sumY - slope * sumX) / n
    let meanY = sumY / n
    let ssTot = 0, ssRes = 0
    for (let i = 0; i < n; i++) {
        ssTot += Math.pow(values[i] - meanY, 2)
        ssRes += Math.pow(values[i] - (slope * i + intercept), 2)
    }
    let r2 = ssTot === 0 ? 0 : 1 - ssRes / ssTot
    return { slope, intercept, r2 }
}

function detectAnomaly(closes, volumes) {
    if (closes.length < 60) return null
    let anomalies = [], score = 0
    let slice120 = closes.slice(-Math.min(120, closes.length))

    // ── Anomaly 1: Slow Climb ──────────────────────────────────
    let totalChange = (slice120[slice120.length - 1] - slice120[0]) / slice120[0]
    let maxSingle = 0
    for (let i = 1; i < slice120.length; i++) {
        let change = Math.abs(slice120[i] - slice120[i - 1]) / slice120[i - 1]
        if (change > maxSingle) maxSingle = change
    }
    if (totalChange > 0.05 && maxSingle < 0.015) {
        score++
        anomalies.push(`Slow climb: total +${(totalChange * 100).toFixed(1)}%, max single bar ${(maxSingle * 100).toFixed(2)}%`)
    }

    // ── Anomaly 2: Linear Volume Growth ────────────────────────
    let volSlice = volumes.slice(-60)
    let volReg = linearRegression(volSlice)
    if (volReg.slope > 0 && volReg.r2 > 0.5) {
        score++
        anomalies.push(`Linear volume growth: slope ${volReg.slope.toFixed(4)}, R² ${volReg.r2.toFixed(2)}`)
    }

    // ── Anomaly 3: Pullback Narrowing (tracks lowest price per pullback) ──
    let pullbacks = [], localHigh = closes[0]
    let inPullback = false, pullbackLow = closes[0]
    for (let i = 1; i < slice120.length; i++) {
        if (closes[i] > localHigh) {
            if (inPullback) {
                pullbacks.push((localHigh - pullbackLow) / localHigh)
                inPullback = false
            }
            localHigh = closes[i]
        } else if (closes[i] < localHigh * 0.99) {
            if (!inPullback) {
                inPullback = true; pullbackLow = closes[i]
            } else if (closes[i] < pullbackLow) {
                pullbackLow = closes[i]
            }
        }
    }
    if (pullbacks.length >= 3) {
        let first = pullbacks.slice(0, Math.floor(pullbacks.length / 2))
        let last = pullbacks.slice(Math.floor(pullbacks.length / 2))
        let firstAvg = first.reduce((a, b) => a + b, 0) / first.length
        let lastAvg = last.reduce((a, b) => a + b, 0) / last.length
        if (lastAvg < firstAvg * 0.6) {
            score++
            anomalies.push(`Pullback narrowing: early ${(firstAvg * 100).toFixed(2)}%, recent ${(lastAvg * 100).toFixed(2)}%`)
        }
    }

    // ── Anomaly 4: Consolidation Breakout ──────────────────────
    let ma60 = closes.slice(-60).reduce((a, b) => a + b, 0) / 60
    let ma120 = closes.length >= 120
        ? closes.slice(-120).reduce((a, b) => a + b, 0) / 120
        : ma60
    let currentPrice = closes[closes.length - 1]
    if (Math.abs(ma60 - ma120) / ma120 < 0.02 && currentPrice > ma60 * 1.03) {
        score++
        anomalies.push(`Consolidation breakout: MA60=${ma60.toFixed(3)}, MA120=${ma120.toFixed(3)}, current=${currentPrice.toFixed(3)}`)
    }

    // ── Anomaly 5: Volume Surge ────────────────────────────────
    let recentVol = volumes.slice(-5).reduce((a, b) => a + b, 0) / 5
    let baseVol = volumes.slice(-65, -5).reduce((a, b) => a + b, 0) / 60
    if (baseVol > 0 && recentVol > baseVol * 2.5) {
        score++
        anomalies.push(`Volume surge: recent 5-bar avg is ${(recentVol / baseVol).toFixed(1)}x baseline`)
    }

    return { score, anomalies }
}
Each triggered anomaly adds one point, for a maximum of 5. Only candidates scoring 2 or above advance to the next stage. A single signal may be random noise; stacking signals lends credibility to the capital behavior hypothesis—this is the core assumption behind the entire K-line detection logic.
News Search: Finding a Fundamental Explanation for the Anomaly
K-line signals are evidence that “money is moving,” but why it’s moving and whether there’s a basis for it requires the information side for verification. This step searches news for each K-line anomaly candidate to check for corresponding event support.
This uses the Brave Search API, which offers 2,000 free requests per month—sufficient for the main line’s pace of one cycle every 10 minutes. Search keywords are extracted from the symbol, stripping direction suffixes and delimiters to reconstruct readable event description terms.
const q = item.symbol
    .replace("_USDC.No", "")
    .replace("_USDC.Yes", "")
    .replace(/-/g, "+")

const rawResponse = HttpQuery(
    "https://api.search.brave.com/res/v1/web/search?q=" + q,
    { method: "GET", headers: { "X-Subscription-Token": CONFIG.BRAVE_API_KEY } }
)

// Iterate all returned sections (web, news, etc.), extract structured fields uniformly
Object.keys(data).forEach(key => {
    const section = data[key]
    if (section && section.results && Array.isArray(section.results)) {
        section.results.forEach(r => {
            news.push({ type: key, title: r.title, description: r.description, age: r.age })
        })
    }
})
The retrieved news is packaged together with K-line data and fed into the next step’s AI analysis—validating along two tracks simultaneously is far more reliable than looking at either one alone.
Multi-Role AI Analysis: Four Perspectives to Prevent Self-Persuasion
With data prepared, the pipeline enters the AI analysis node, where the model can be selected according to your needs. The prompt defines four independent roles—this is the system’s single most critical design decision and deserves its own explanation.
If you let a single AI simultaneously view K-line data and news, it easily cross-validates between the two, arriving at a superficially reasonable but actually independently unverified conclusion—using capital signals to endorse the news, then using the news to endorse the capital signals, ultimately producing a self-reinforcing “I think we should buy.” Role isolation forces information source independence: each role sees only its own data, outputs only its own dimensional conclusion, and the final decision role sees only conclusions—never the process.
Role 1: K-Line Capital Analyst — Sees no news; only examines price and volume anomalies to determine whether real capital is consistently buying. Outputs capital signal strength (Strong / Moderate / Baseline).
Role 2: News & Sentiment Analyst — Sees no K-line data; only evaluates the information landscape to determine whether a positive catalyst exists that hasn’t been priced in. Outputs news support level (Strong / Weak / None).
Role 3: Price Assessment Analyst — Synthesizes conclusions from the first two roles, estimates the event’s true probability range, compares it to the current market price, and outputs an Undervalued / Fair / Overvalued assessment. This role has a built-in expiry date weighting rule: for events more than 7 days out, normal estimation applies; for events within 3 days where market price exceeds 0.15, the probability range is forcibly narrowed and “Significantly Undervalued” output is prohibited. The reasoning is straightforward—close to expiry, market participants possess more complete real-time information than the AI’s training data, so the AI’s judgment should defer to market pricing.
Role 4: Final Decision Analyst — Aggregates the three preceding roles’ conclusions according to a decision matrix and outputs the final action. The matrix logic: capital signal is the prerequisite, news provides verification, and together they determine confidence level; but regardless of confidence, if the price assessment doesn’t reach “Undervalued,” no action is taken.
The news verification here is not about chasing information—it’s about determining whether capital behavior already has fundamental support. When insider capital accumulates, the information won’t appear in public news. But when capital signals coincide with news support, it indicates information is in the mid-diffusion stage and the market still has a pricing lag—this is the window the strategy is truly trying to capture.
| Capital Signal \ News Support | Strong Verification | Weak Verification | No Verification |
|---|---|---|---|
| Strong (score 4–5) | Buy, confidence = High | Buy, confidence = Medium | No action |
| Moderate (score 3) | Buy, confidence = Medium | Watch | No action |
| Baseline (score 2) | Watch | No action | No action |
The AI’s output format is strictly JSON, containing each role’s conclusion, true probability range, price assessment, final decision, confidence level, and risk list—consumed directly by the downstream execution node.
Trade Execution: Only Buy the Single Best Candidate
After the AI scores each batch of candidates individually, the execution layer doesn’t place orders for every buy signal—the system picks only the highest-scoring one. Ranking criteria in order: confidence (High > Medium > Low) → price assessment (Significantly Undervalued > Undervalued) → true probability range width (narrower means more certain judgment).
const buySignals = signals.filter(s => s.signal === 'buy')
bestSignal = buySignals.sort((a, b) => {
    const confDiff = (confidenceRank[b.confidence] || 0) - (confidenceRank[a.confidence] || 0)
    if (confDiff !== 0) return confDiff
    const assessDiff = (assessmentRank[b.priceAssessment] || 0) - (assessmentRank[a.priceAssessment] || 0)
    if (assessDiff !== 0) return assessDiff
    // Narrower range = more certain, prioritize narrow
    const aWidth = (a.trueProb.max || 0) - (a.trueProb.min || 0)
    const bWidth = (b.trueProb.max || 0) - (b.trueProb.min || 0)
    return aWidth - bWidth
})[0]
After selecting a candidate, the system fetches the real-time ask price from the order book, confirms sufficient balance, and submits a limit order. After submission, order status is polled with a maximum wait of 30 seconds; if it times out, the order is canceled to prevent hanging order buildup. If the current cycle’s ask price multiplied by the configured share amount falls below the 1 USDC minimum order threshold, the system automatically rounds up to ceil(1/askPrice) for the minimum executable shares.
Stop-Loss Module: Trailing Stop + Absolute Floor
The secondary line executes every 30 seconds, with logic in two steps: first handle expiry redemptions, then check active positions for trailing stop-loss.
Polymarket has a special mechanism—after contract expiry, funds don’t automatically return to your account; you must actively call redeem. The strategy scans for redeemable positions at the beginning of each secondary line cycle, batch-releasing funds to prevent capital from being locked up long-term.
The trailing stop-loss core is a dual-track stop price design: the trailing stop line (historical highest bid price − fixed drop amount LOSS_AMOUNT) and the absolute floor line (entry price × 50%). The effective stop price takes whichever is higher.
function calcStopPrice(entryPrice, maxPrice) {
    const trailingStopPrice = maxPrice - CONFIG.LOSS_AMOUNT
    const absoluteStopPrice = entryPrice * CONFIG.FALLBACK_STOP_RATIO  // fixed 0.50
    const usingFallback = trailingStopPrice < absoluteStopPrice
    const effectiveStopPrice = usingFallback ? absoluteStopPrice : trailingStopPrice
    return { effectiveStopPrice, trailingStopPrice, absoluteStopPrice, usingFallback }
}
This dual-track design addresses two typical position scenarios: during the profit phase, the trailing stop line rises with price, locking in floating gains; when the position moves against you immediately after entry, the trailing stop line may drop to near-zero or negative territory, at which point the absolute floor (entry price × 50%) takes over, preventing a position from riding all the way to zero before exiting. The two lines each serve their purpose—neither is dispensable.
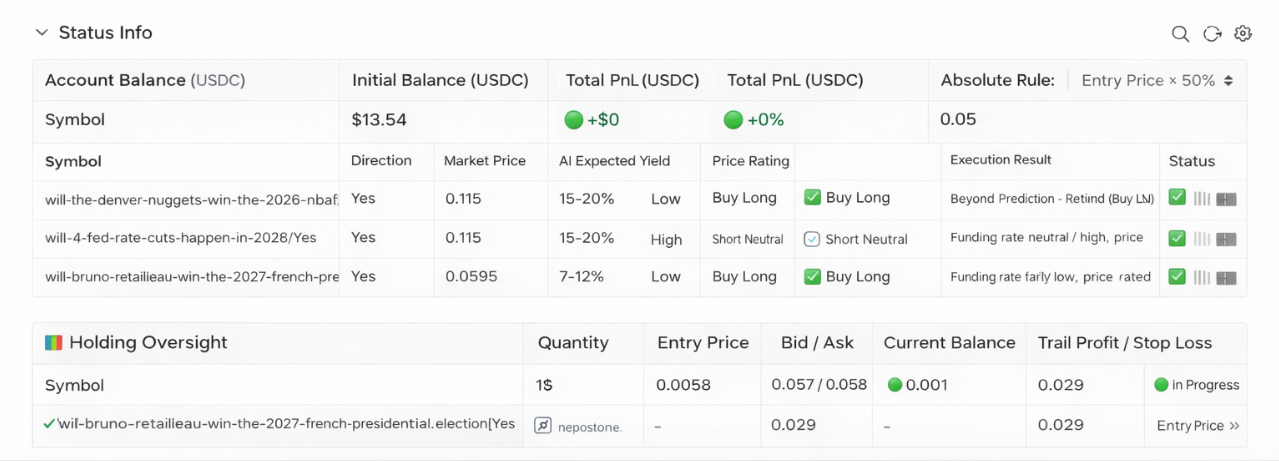
After a stop-loss triggers, a market sell order is placed, the historical high price cache for that market is cleared, and the system waits for the next entry signal. The dashboard displays each position’s remaining distance to stop-loss in real time, color-coded by alert severity, enabling manual review.
Key Design Decisions
Why Multi-Role Instead of a Single Comprehensive Prompt?
This was partially addressed in the analysis module section, but it’s worth elaborating. The problem with a single prompt isn’t just “self-persuasion”—there’s a more subtle risk: when AI simultaneously processes K-line data and news text, it tends to use the latter to explain the former, “rationalizing” K-line anomalies as inevitable reflections of news rather than evaluating both as independent signals. Role isolation fundamentally introduces two independent information chains. Only when both chains converge on the same direction during final aggregation is the credibility genuine.
Why Only Buy the Single Best Per Cycle Instead of Diversifying?
Diversified holding has mature theoretical support in traditional finance, but the logic doesn’t fully translate to prediction markets. Prediction market outcomes are binary—zero-out risk is real. If you simultaneously hold three moderate-confidence positions and two go to zero while one appreciates, you may not break even overall. The current strategy’s choice: concentrate bets on accuracy rather than dilute quality-inconsistent signals with quantity. This trade-off isn’t necessarily optimal, but it’s internally consistent.
Why Make the Expiry Date Weighting Rule a Hard Constraint?
Close to expiry, market prices reflect participants’ real-time expectations, and a significant proportion of these participants possess fresher information than the AI’s training data. If the AI still outputs “price is significantly undervalued, should buy” at this point, it’s very likely that its information is already stale. Making this a constraint rather than a suggestion is necessary because relying on an AI to recognize “my information isn’t fresh enough” is unrealistic—external enforcement is required.
Live Trading Observations
Based on actual running logs, the strategy’s funnel ratio is quite steep. In one particular run, 141 markets passed initial screening, K-line anomaly detection reduced them to 3, and ultimately only 1 met all three criteria—capital signal, news support, and price assessment—triggering an order. The other two were skipped due to “Fair” price assessment and insufficient composite scoring respectively. This demonstrates the strategy’s overall conservatism: it would rather stay flat than lower standards. During calm market periods with no notable news events, the system may go an entire day without producing a single buy signal. This is a design choice, not a bug.
There have also been cases where K-line anomalies were later proven to be false breakouts—capital briefly entered then withdrew, with the trailing stop intervening to exit. News analysis likewise contains noise; coverage of relevant events may itself be lagging or biased, and AI alone cannot fully identify these issues.
The dashboard displays account equity, position status (current Bid/Ask, historical high, drawdown distance to stop-loss, stop-loss mode), and AI decision details in real time for manual review.
Closing Thoughts
Honestly, this system is more of a functional framework of ideas than a plug-and-play money printer. The core logic—capital behavior tracing, dual-track news verification, multi-role AI judgment—has reasonable foundations conceptually, but in real markets, signal quality is inconsistent, AI judgment makes mistakes, and price convergence risk near expiry is ever-present.
There’s plenty of room for improvement: trading targets could be further focused on domains you’re familiar with, AI prompts could be redesigned to match your trading style, the weights and thresholds for five K-line anomaly types all have tuning potential, and stop-loss coefficients deserve iteration based on actual position performance. The code is fully open-source—feel free to fork and modify.
Risk Disclaimer
Prediction market positions carry binary outcome characteristics with real zero-out risk. K-line anomaly signals and AI analysis conclusions do not constitute investment advice, and historical signal performance does not represent future returns. This strategy has not been validated over long time periods in live trading, and parameter settings significantly impact results. Before using this strategy for live trading, please fully understand Polymarket’s platform rules, contract expiry mechanisms, and liquidity risks, and independently assess your tolerance for principal loss.