Summary
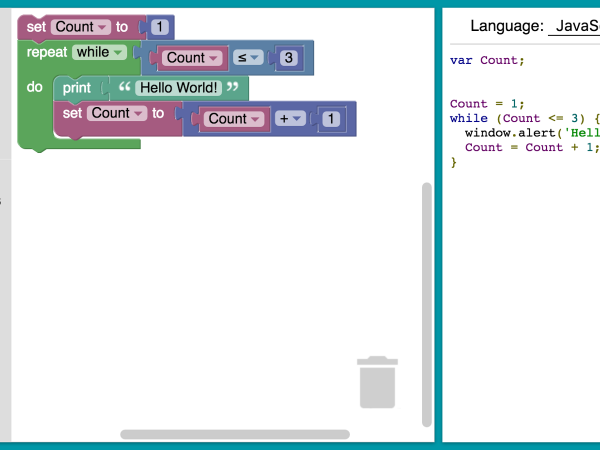
In the previous section, we learned about the introduction and characteristics of the visual programming tool, the ” hello world ” example, and the strategy writing on the FMZ Quant trading platform to explain the premise of implementing the trading strategy. In this article, we continue to write strategy with the usual strategy modules and technical indicators, and then moving to the strategy logic, step by step to help you achieve a complete intraday trading strategy.
Strategy Module
Stage increment
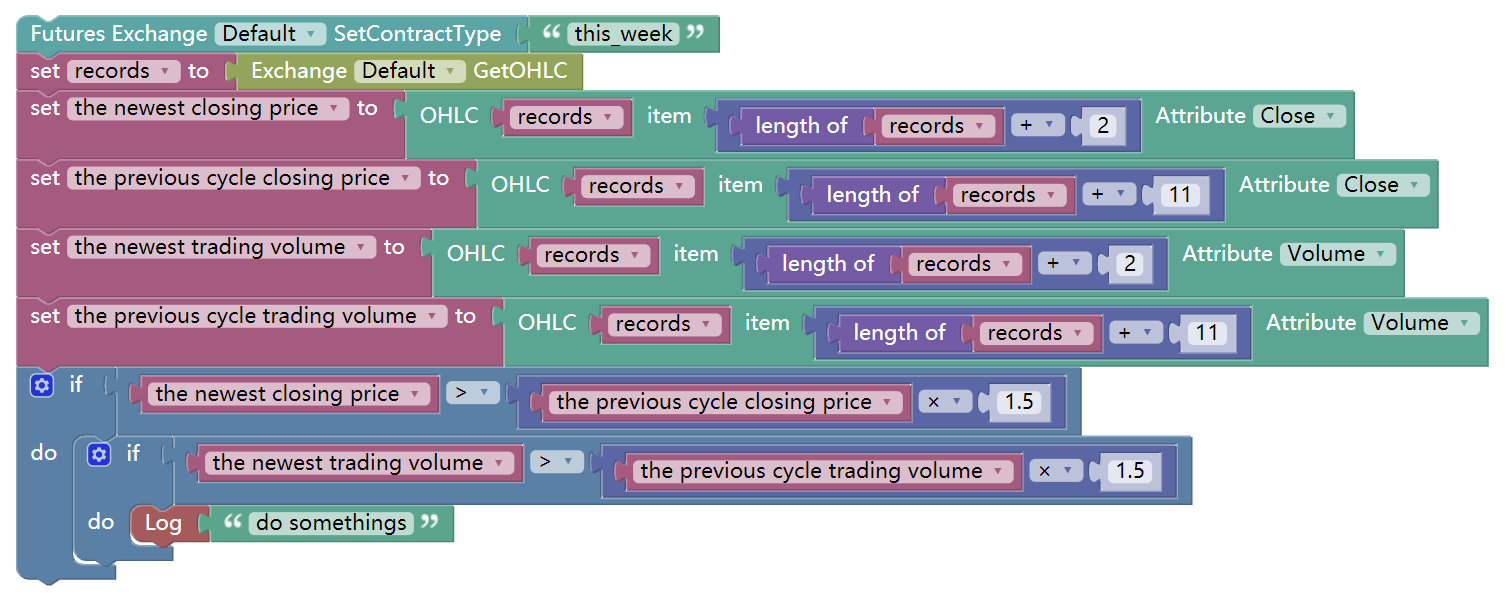
1, the percentage of stage rasing K-line is calculated by closing price of current K line with the difference of the previous closing price of N periods. For example: Computing the stage rasing of the latest 10 K lines, can be written:
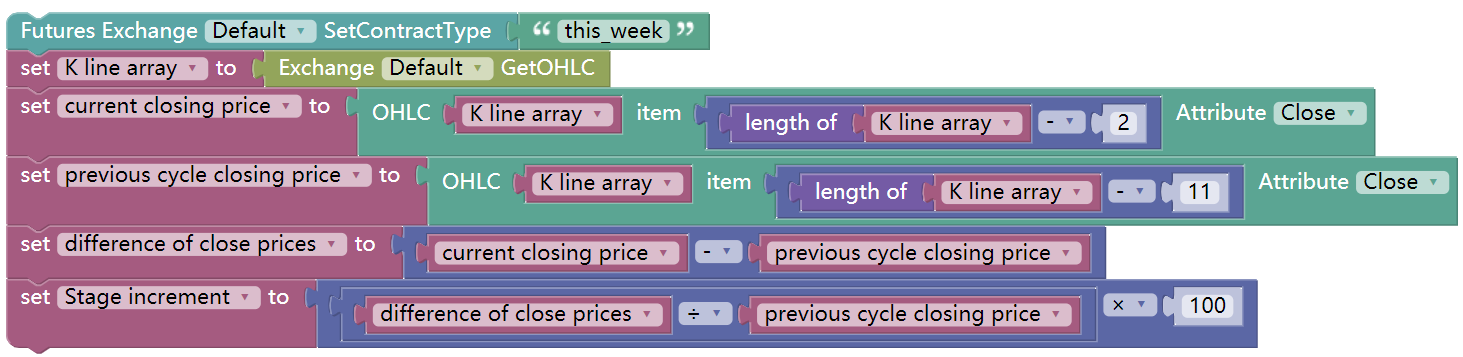
In the above code, the way a computer to execute the strategy requires a complete cycle, for example, to calculate the latest 10 k line stage increment, you need to be split into the following steps:
1, the computer must clearly know what kind of period of k line you want to trade. For example, set the contract code to “ this_week ” means trading on the weekly k line.
2, After setting the contract code, you can get the K line data of the contract.
3, With the K-line data, you can get detailed data of any specific K-line from it.
4, In order to get the statistical data of stage increment, it must first obtain two K-line closing price, for example: the pervious k-line closing price data and the 11th k-line closing price data before it.
5, Finally, calculating the stage increment from these 2 K-line closing price.
Each of the following strategies will have such clear logic statement as above, after you understand the logic statement, visual programming becomes much easier.
Price raise with massive trading volume increase
For example: If the current K line’s closing price is 1.5 times of the closing price of the previous 10 K-lines, which means in 10 days, the price has risen 50%; and the trading volume also increased more than 5 times of the pervious 10 K-lines. can be written:
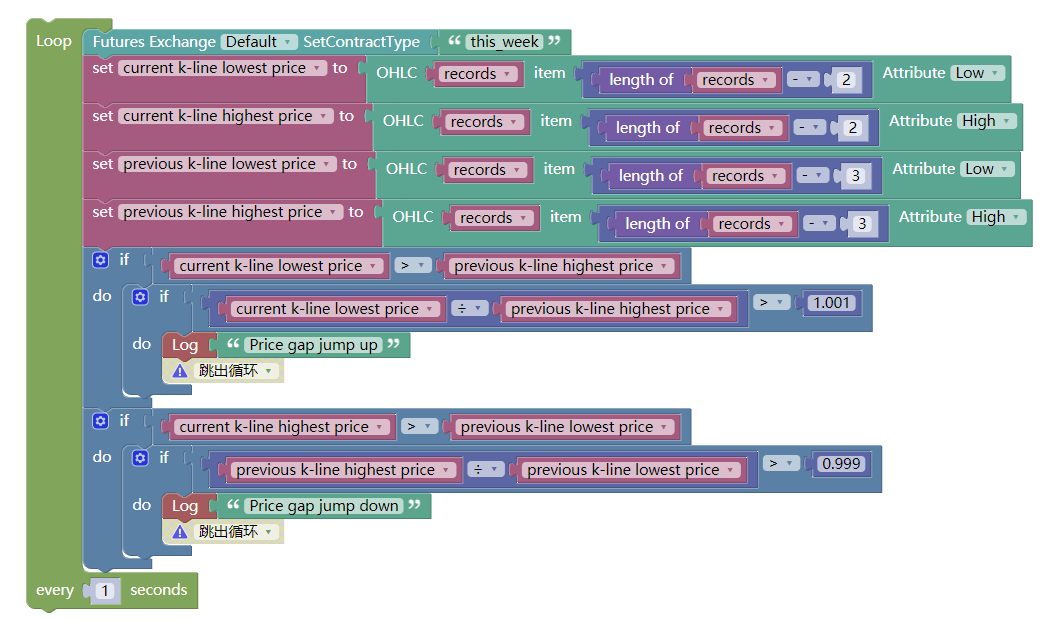
Price gap jumping
The price gap is the case where the highest and lowest prices of the two K lines are not connected. It consists of two K lines, and the price gap is the reference price of the support and pressure points in the future price movement. When a price gap occurs, it can be assumed that an acceleration along the trend with original direction has begun. can be written:
Common technical analyse indicators
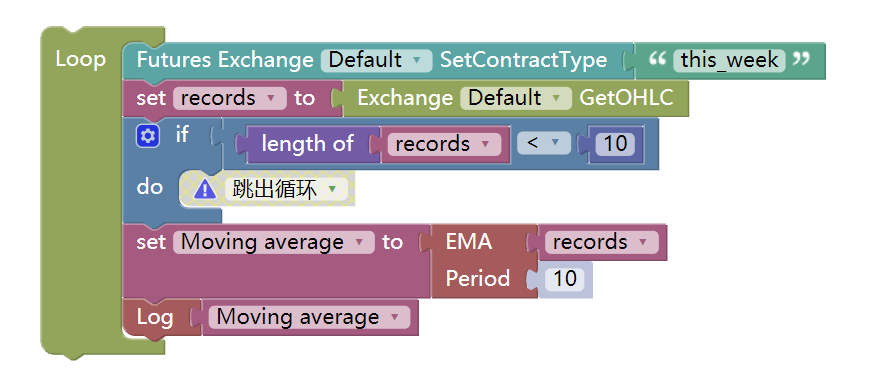
- Moving average
From a statistical point of view, the moving average is the arithmetic average of the daily price, which is a trending price trajectory. The moving average system is a common technical tool used by most analysts. From a technical point of view, it is a factor that affects the psychological price of technical analysts. The decision-making factor of thinking trading is a good reference tool for technical analysts. The FMZ Quant tool supports many different types of moving averages, as shown below:
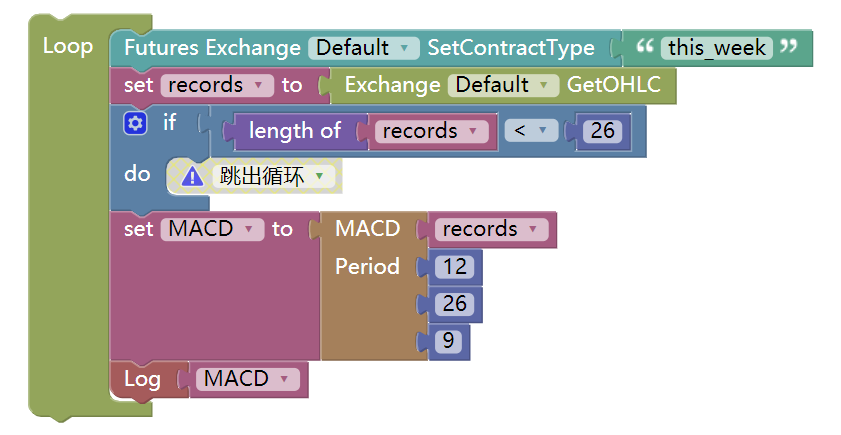
- MACD Indicator
The MACD indicator is a double smoothing operation using fast (short-term) and slow (long-term) moving averages and their aggregation and separation. The MACD developed according to the principle of moving averages removes the defect that the moving average frequently emits false signals, and also retains the effect of the other good aspect. Therefore, the MACD indicator has the trend and stability of the moving average. It was used to study the timing of buying and selling stocks and predicts stock price change. You can use it as follows:
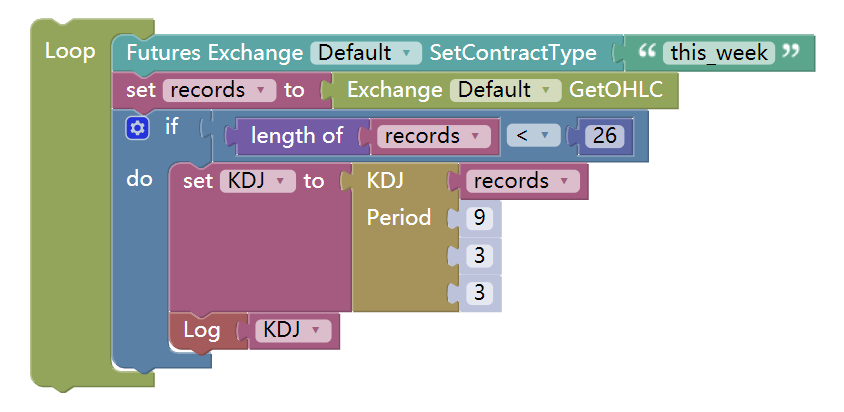
- KDJ indicator
KDJ indicator is a technical indicator used to analyze and predict changes in stock trends and price patterns in a traded asset. KDJ indicator is otherwise known as the random index. It is a very practical technical indicator which is most commonly used in market trend analysis of short-term stock.
KDJ is a derived form of the Stochastic Oscillator Indicator with the only difference of having an extra line called the J line. Values of %K and %D lines show if the security is overbought (over 80) or oversold (below 20). The moments of %K crossing %D are the moments for selling or buying. The J line represents the divergence of the %D value from the %K. The value of J can go beyond [0, 100] for %K and %D lines on the chart.
Strategy writing
Warren Buffett’s mentor, Benjamin Graham, once mentioned in the book <<The Intelligent Investor>> a trading model in which stock and bonds are dynamically balanced.

- This trading model is very simple:
50% of the funds in the hands are invested in equity funds, and the remaining 50% are invested in bond funds. That is, stocks and bonds each account for half.
An asset position rebalancing based on fixed intervals or market changes restores the ratio of stock assets to bond assets to an initial 1:1.
This is the whole logic of the entire strategy, including when to buy and sell, and how much to buy and sell. How simple and effect it is!
NO.2
In this method, the volatility of bond funds is actually very small, far below the stock volatility, so bonds are used here as “reference anchors”, that is, using bonds to measure whether the stocks are rising too much or too little.
If the stock price rises, the market value of the stock will be greater than the market value of the bond. When the market value ratio of these two exceeds the set of a threshold, the total position will be readjusted, the stock will be sold, and the bond will be bought to make the stock value to bond value ratio to restore to the initial 1:1.
Conversely, if the stock price falls, the market value of the stock will be less than the market value of the bond. When the market value ratio of the these two exceeds the set of a threshold, the total position will be readjusted, the stock will be bought, and the bond will be sold to make the market capitalization ratio of the bond value to stock value to restore to the initial 1:1.
In this way, the ratio between the dynamic balance of stocks and bonds is enough to enjoy the profit of stock growth and reduce asset volatility. As a pioneer in the value investing, Graham provided us with a wonderful idea.
Since this is a complete and mutual strategy, why don’t we use it on cryptocurrency market?
NO.3
- Blockchain Assets Dynamic Balance Strategy in BTC
Strategy logic
According to the current value of BTC, the account balance is retained at $5000 cash and 0.1 BTC, ie the initial ratio of cash to BTC market value is 1:1.
If the price of the BTC rises to $6000, that is, the BTC market value is greater than the account balance, and the difference between them exceeds the set threshold, then (6000-5000)/6000/2 coins are sold. It means that BTC has appreciated and we need to exchange the cash back.
If the price of the BTC falls to $4000, ie the BTC market value is less than the account balance and the difference between them exceeds the set threshold, buy (5000-4000)/4000/2 coins. It means that BTC has depreciated and we need to buy BTC back.
In this way, regardless of whether the BTC is appreciated or depreciated, the account balance and the market value of the BTC are always kept dynamically equal. If the BTC is devalued, buy some, and then sell it when it raises again, just like the balance scales.
- Buying conditions : If the current position market value minus the current available balance is less than 5% of the current available balance, open the position to buy.
- Selling conditions : If the current position market value minus the current available balance is greater than 5% of the current available balance, open the position to sell.
Prerequisite
- Current market quote
- Current assets
- Total market value of coins
- The value difference of fiat money and coins
Strategy construction
- Visual programming Step 1
We calculates the above four premise conditions, and assign them to each different variable. the code block is like this:
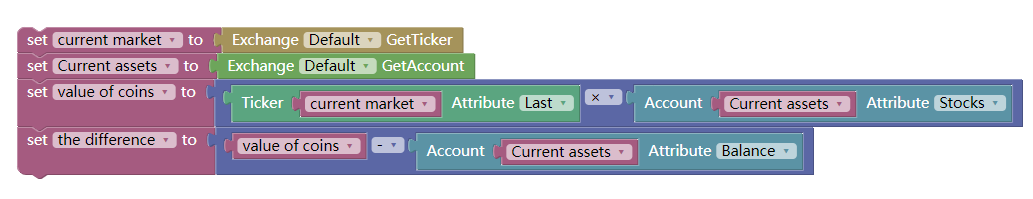
Notice that the total value of coins is the total market value of coins that current holding. The calculation method is that the current total number of positions is multiplied by the latest price. The difference in assets is the total market value of the coins minus the current available balance.
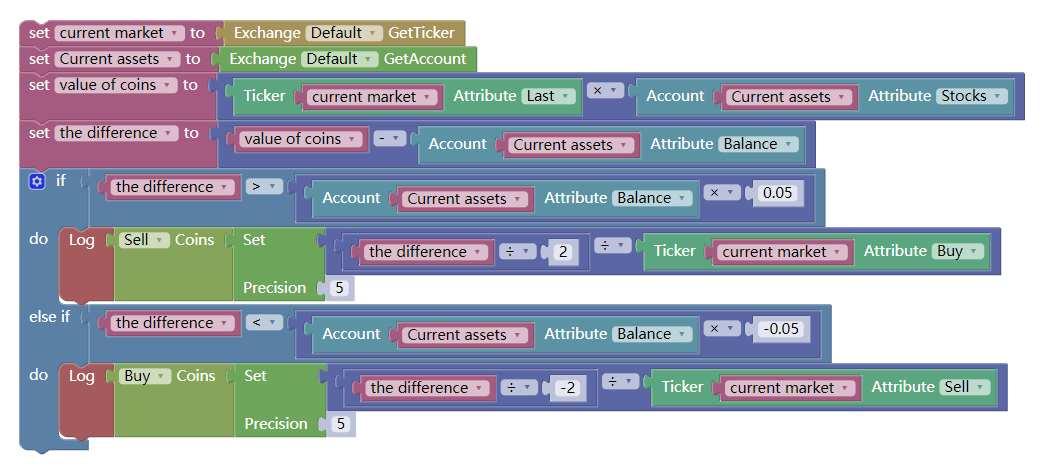
- Visual programming Step 2
After the prerequisite conditional assignment is completed, you need to write the trading logic. This is not as complicated as it seems. It is nothing more than the above strategy logic, expressed in the form of code blocks.
That is, If the current position market value minus the current available balance is less than 5% of the current available balance, open the position to buy. If the current position market value minus the current available balance is greater than 5% of the current available balance, open the position to sell. as shown below:
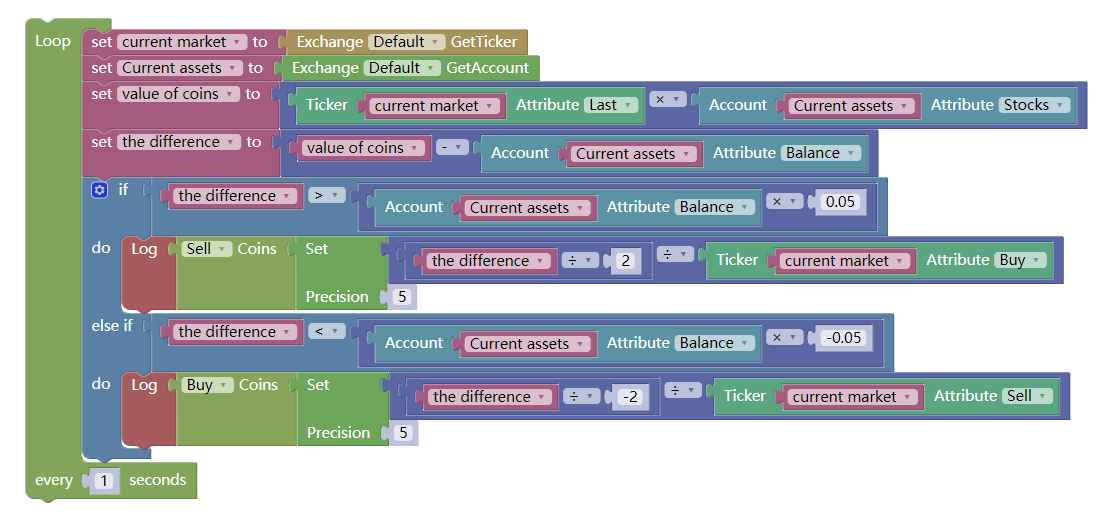
The whole strategy seems to have been written, but be aware that the program is executed from top to bottom and stops after execution. But our trading strategy is not to execute the trading conditions once, but to repeat the execution.
In other words, the program needs to constantly check whether the strategy conditions have been reached, and if it is, execute the logic, otherwise it will continue to check. For this purposes, you need to use another loop statement, as shown below:
Strategy backtest
The visual programming strategy is not fundamentally different from the strategies written in other programming languages. It also supports historical data testing of various cycles and precision. The following is the backtesting information for this strategy:
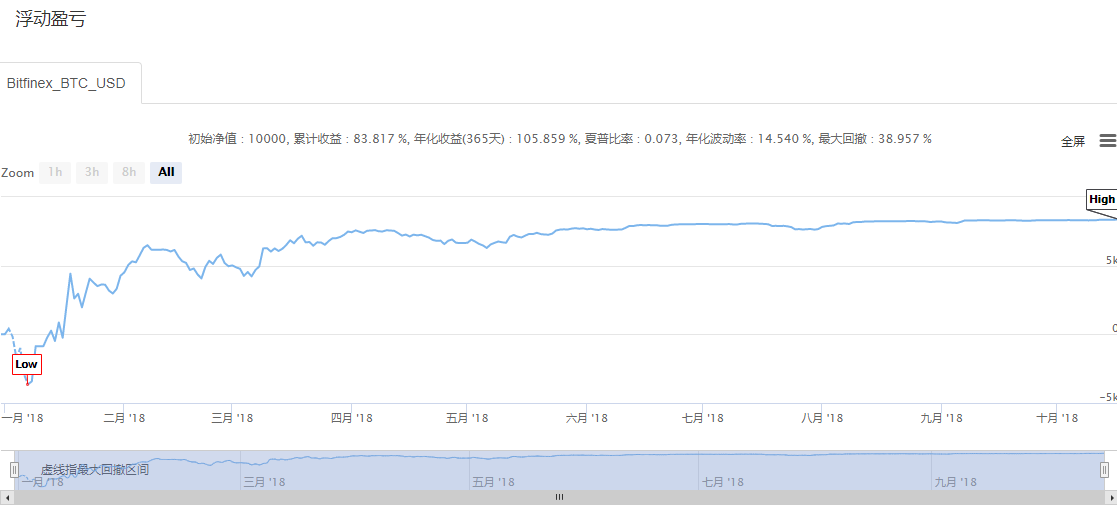
At this point, a complete trading strategy is considered done. In order to take care of the people who still confused, this strategy has been shared on the FMZ Quant Strategy Square page and can be directly copied to your dashboard.
End
The 10,000-hour law (To be a pro on certain job) always exists, but for a zero-based trader, it is impossible to spend 10,000 hours to research a new field. So you have to have a ladder, and for zero-programmer-based traders, the FMZ Quant visual programming is the quick-start ladder.
With visual programming, you don’t have to remember the grammar writing of traditional programming language when you use the function modules. The FMZ Quant platform is intended to help more quantitative traders to lower the entry barrier and increase their interests. Everyone can become a quantitative trader!
However, visual programming as a stepping stone to quantitative entry is completely okay, but it also has its own limitations, such as the inability to develop overly complex and overly refined trading strategies. But this does not affect the first step in your quantitative trading!
Next section notice
From the professionalism of quantitative trading, whether it is the M language or the visual programming, they are all just a transitional language that enters the world of quantitative trading. Their linguistic characteristics determines the limitations in trading strategy development, a number of complex strategies are less likely to achieve. The following sections will show you how to learn the JavaScript language, it is a formal high-level programming language, it is the path you step into the senior quantitative trading.
After-school exercises
- Try to implement Bollinger Bands indicators in the visual programming.
- Try to complete a trading strategy using the trading module in this section.