When designing a strategy, it is often necessary to design a strategy chart to display, when writing strategies in JavaScript language, Python language, users who are unfamiliar with programming or the charting library used in the FMZ platform often struggle with code design for drawing on custom charts. So how can you draw a strategy chart with rich content by only a small amount of code?
This simple and powerful way of drawing can be seen in the Pine language, which is known for its rich drawing functions. If the drawing interface of the Pine language can be connected to the strategies of JavaScript and Python languages, it will greatly facilitate the drawing function of the developer’s design strategy. Therefore, based on this demand, the FMZ platform has upgraded the custom drawing function and expanded the way to use the KLineChart function to draw custom charts. You can refer to the API documentation at: https://www.fmz.com/api#klinechart
Let’s start by writing a simple example using the JavaScript language to transition.
Simple example
/*backtest
start: 2022-03-21 09:00:00
end: 2022-06-21 15:00:00
period: 30m
basePeriod: 15m
exchanges: [{"eid":"Binance","currency":"BTC_USDT"}]
*/

function main() {
    var c = KLineChart()
    while (true) {
        var bars = _C(exchange.GetRecords)
        for (var i = 0 ; i < bars.length ; i++) {
            var bar = bars[i]
            c.begin(bar)
            c.plot(bar.Volume, "Close")
            c.close()
        }
        Sleep(1000)
    }
}
This example is very simple, just draw a K-line chart in the custom drawing area of the strategy, and draw a volume curve corresponding to each K-line BAR in the sub-chart position of the chart.
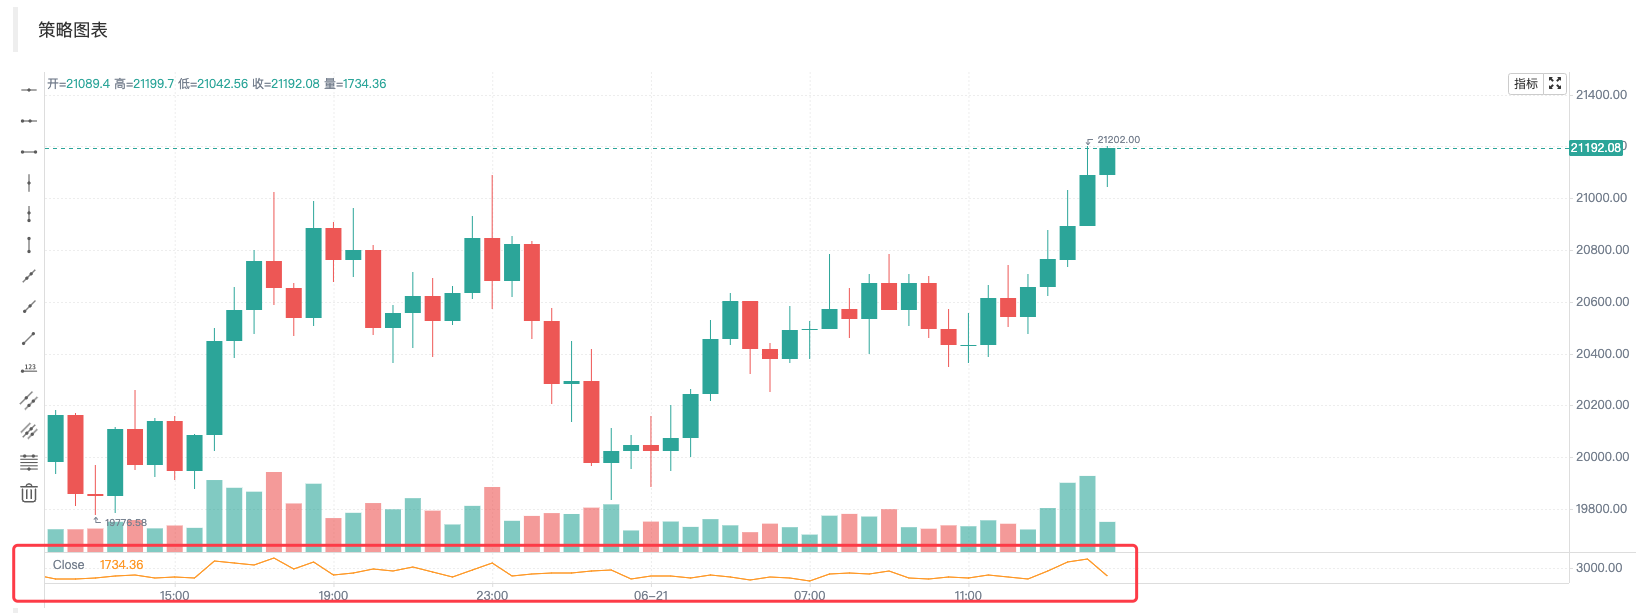
In the code, we use var c = KLineChart() to create a chart object first, and then use its method to draw a chart. Then in the loop, we obtain the K-line data (array structure), and traverse the K-line array. It can be traversed by using a simple for loop as in the example, or it can be traversed in other ways.
The drawing operation start with the c.begin(bar) function and end with the c.close() function. The begin and close functions are all methods of the chart object c. Next, use the most commonly used drawing function plot to draw the volume curve on each BAR.
A more complex example
Suppose we want to design a chart with the Bollinger indicator attached. And it also comes with a volume chart of each BAR, which can be designed like this:
/*backtest
start: 2022-03-21 09:00:00
end: 2022-06-21 15:00:00
period: 1d
basePeriod: 1h
exchanges: [{"eid":"Binance","currency":"BTC_USDT"}]
*/

function main() {
    var c = KLineChart()

    // main strategy loop
    while(true) {
        // polling interval
        Sleep(500)

        // get K-line data
        let bars = exchange.GetRecords()
        if (!bars || bars.length <= 20) {
            continue
        }

        // calculate the Bollinger indicator
        var boll = TA.BOLL(bars)

        bars.forEach(function(bar, index) {
            c.begin(bar)
            // drawing operation
            c.plot(boll[0][index], "Boll_Up", {overlay: true})     // Draw on the main chart
            c.plot(boll[1][index], "Boll_Mid", {overlay: true})    // Draw on the main chart
            c.plot(boll[2][index], "Boll_Down", {overlay: true})   // Draw on the main chart
            c.plot(bar.Volume, "volume")                           // Draw on the sub-chart
            c.close()
        })

        // Strategy trading logic
        // ...
        // ..
    }
}
As we can see in the code, our backtest configuration information on the FMZ platform is:
/*backtest
start: 2022-03-21 09:00:00
end: 2022-06-21 15:00:00
period: 1d
basePeriod: 1h
exchanges: [{"eid":"Binance","currency":"BTC_USDT"}]
*/
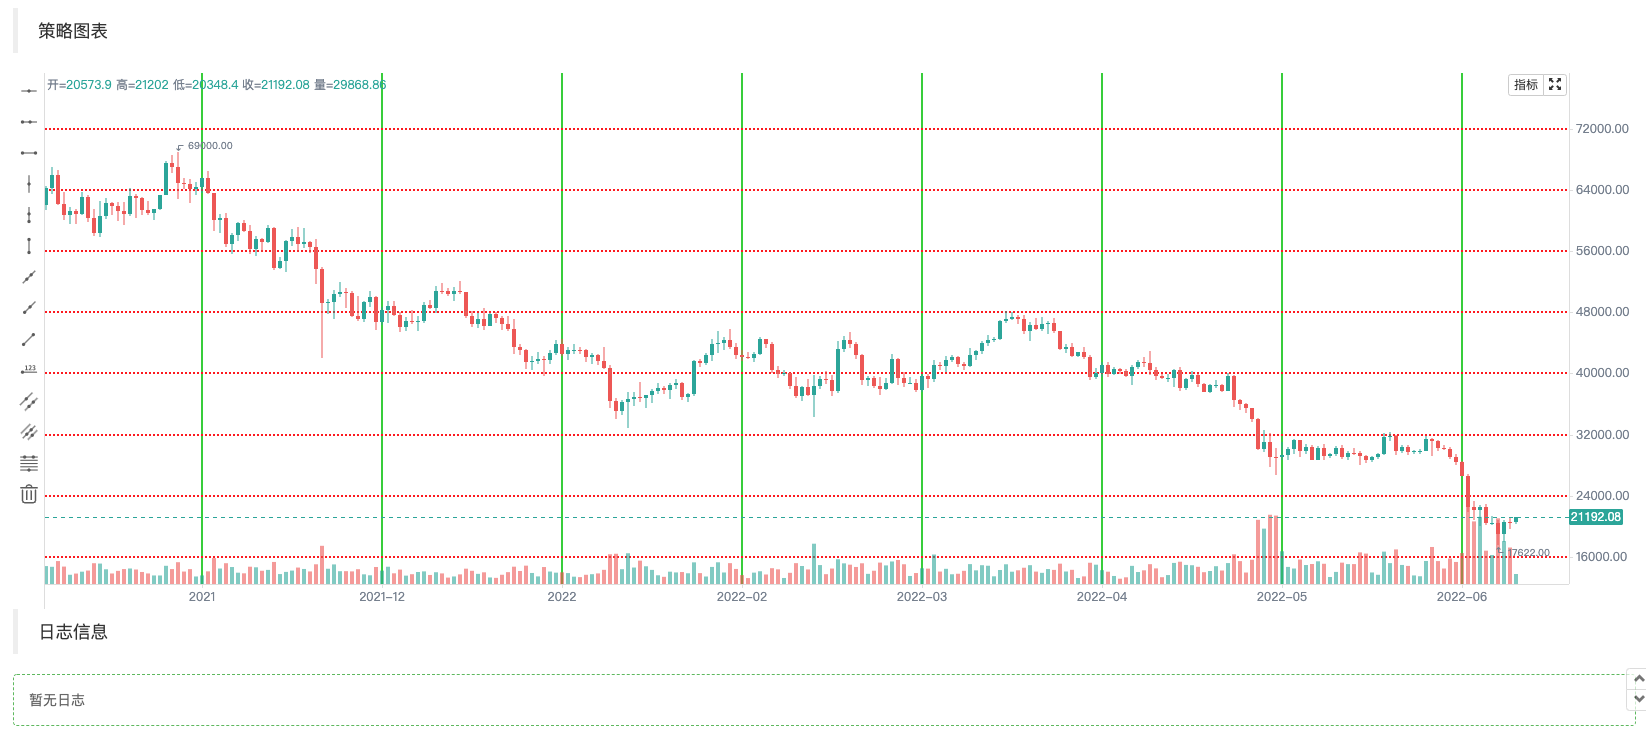
Such a configuration is to use the Binance spot exchange object backtesting test. The backtesting effect is shown as follows:
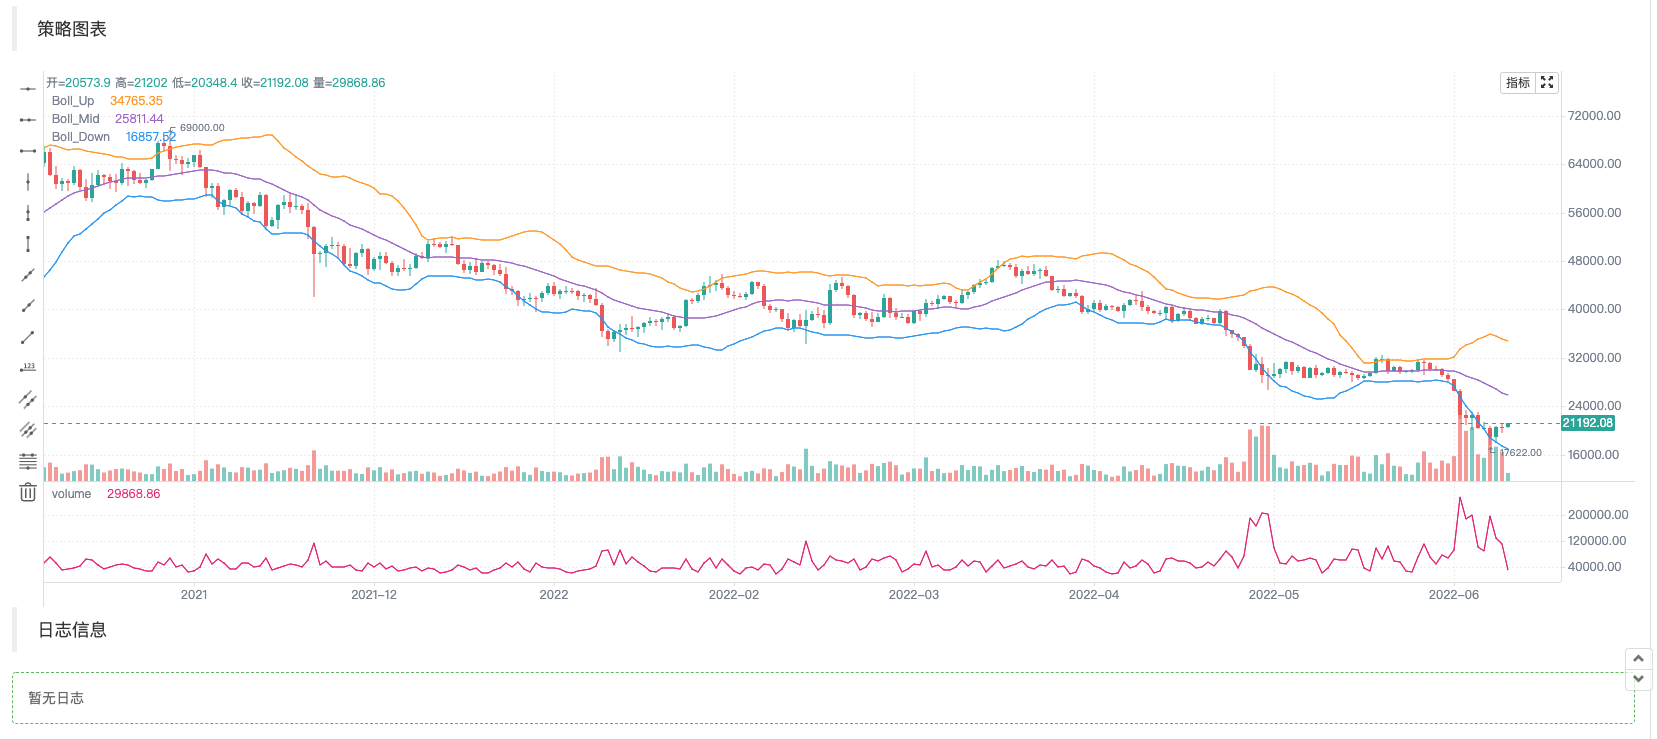
It can be seen that we use Pine’s drawing method, which greatly simplifies the drawing code in the JavaScript language.
Write in indicators and other data to draw charts
The operations of obtaining K-line data and calculating indicators are common and simple in the strategy examples in the Platform Strategy Square and in the API documentation.
        // obtain K-line data
        let bars = exchange.GetRecords()
        if (!bars || bars.length <= 20) {
            // If the acquisition of the K line fails, that is, if !bar is true, execute continue, ignore the following code, and re-execute the loop
            // If bars.length is less than or equal to 20, that is, the number of K-line BAR (bar) is less than 20, the indicator cannot be calculated, and continue is also executed
            continue
        }

        // Calculate the Bollinger indicator
        var boll = TA.BOLL(bars)
The Bollinger indicator calculation function TA.BOLL, if the Bollinger indicator parameters are not specified, the default parameters BOLL(20, 2) are used. The Bollinger indicator has three lines, so the data returned by the TA.BOLL function is a two-dimensional array. boll[0], boll[1], and boll[2] are the three elements of the boll array, each of which represents a line and is an array.
- boll[0]: Bollinger Bands up line
- boll[1]: Bollinger Bands midline
- boll[2]: Bollinger Bands down line
Then we will see how to draw the volume of the K-line data, that is, the volume, and the calculated Bollinger indicator data on the chart.
We draw the K-line data Bar by Bar, so we need to traverse the entire K-line array, that is, traverse the bars array in the code. The forEach method is used here to traverse, or the for loop can be used to traverse.
        bars.forEach(function(bar, index) {
            c.begin(bar)
            // Drawing operations
            c.plot(boll[0][index], "Boll_Up", {overlay: true})     // {overlay: true} Parameter control, drawn on the main chart
            c.plot(boll[1][index], "Boll_Mid", {overlay: true})    // Draw on the main chart
            c.plot(boll[2][index], "Boll_Down", {overlay: true})   // Draw on the main chart
            c.plot(bar.Volume, "volume")                           // Draw on the sub-chart
            c.close()
        })
It should be noted that whenever you start a chart drawing operation on a Bar, you must make a c.begin(bar) function call first. The begin function is one of our chart object c method. At the end of the drawing operation, c.close() needs to be called. Between the begin function and the close function is the drawing function that we call similar to the drawing method of the Pine language. Supports: barcolor bgcolor plot fill hline plotarrow plotshape plotchar plotcandle signal, you can draw lines, arrows, mark information, etc. The parameters of these functions are the same as the function parameters corresponding to the Pine language, and the drawing functions are also the same.
Add the drawing of trading signal arrows, markers, horizontal lines, etc.
Add some trading signal arrows, markers, horizontal lines to the above Bollinger Bands charting example.
/*backtest
start: 2022-03-21 09:00:00
end: 2022-06-21 15:00:00
period: 1d
basePeriod: 1h
exchanges: [{"eid":"Binance","currency":"BTC_USDT"}]
*/

function main() {
    var c = KLineChart({overlay : true})

    // Strategy main loop
    while(true) {
        // Polling interval
        Sleep(500)

        // Obtain K-line data
        let bars = exchange.GetRecords()
        if (!bars || bars.length <= 20) {
            continue
        }

        // Calculate Bollinger indicator
        var boll = TA.BOLL(bars)

        bars.forEach(function(bar, index) {
            c.begin(bar)
            // Drawing operations
            c.plot(boll[0][index], "Boll_Up", {overlay: true})     // Draw on the main chart
            c.plot(boll[1][index], "Boll_Mid", {overlay: true})    // Draw on the main chart
            c.plot(boll[2][index], "Boll_Down", {overlay: true})   // Draw on the main chart
            c.plot(bar.Volume, "volume", {overlay: false})         // Draw on the sub-chart

            c.hline(bar.Open, {overlay: true})                          // Horizontal line
            c.plotarrow(bar.Close - bar.Open, {overlay: true})          // Arrow
            c.plotshape(bar.Close - bar.Open > 0, {style: 'square'})    // Draw square markers
            c.plotchar(bar.Close - bar.Open < 0, {char: 'X'})           // Draw the character X

            c.close()
        })

        // Strategy trading logic
        // ...
        // ..
    }
}
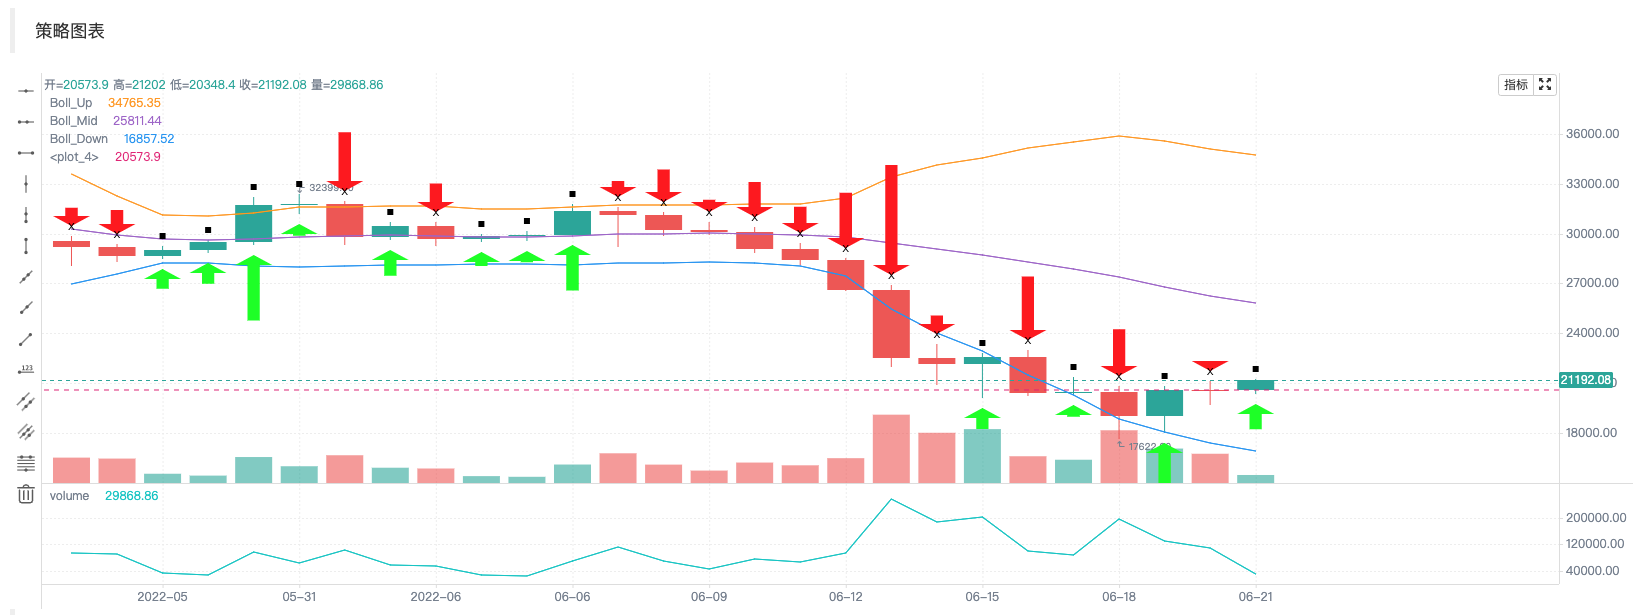
Chart configuration object
A structure can be declared to configure the chart style. For example, the following chartCfg variable represents the configuration information of a grid line.
    var chartCfg = {
        grid: {
            show: true,
            // Grid horizontal line
            horizontal: {
                show: true,
                size: 2,
                color: '#FF0000',    // Color of horizontal grid line
                // 'solid'|'dash'
                style: 'dash',       // Type of line
                dashValue: [2, 2]
            },
   	        // Grid vertical line
            vertical: {
                show: true,
                size: 2,
                color: '#32CD32',
                // 'solid'|'dash'
                style: 'solid',
                dashValue: [2, 2]
            }
        },
    }
The chart configuration object is the data structure that sets some properties and appearance of the chart. For example, a grid line style configuration is used in the example. There are also many options that can be configured and modified, such as X-axis, Y-axis related settings, cursor line settings, alert message settings, technical indicator style settings, K-line BAR style settings, etc.
Of course, if you are not familiar with these, you can not pass in the chart configuration object when calling the KLineChart function to create a chart object. Then the created chart is the default style. Use the API function KLineChart function of the FMZ platform to create a chart object:
var c = KLineChart(chartCfg)
Test code for drawing grid lines:
/*backtest
start: 2022-03-21 09:00:00
end: 2022-06-21 15:00:00
period: 1d
basePeriod: 1h
exchanges: [{"eid":"Binance","currency":"BTC_USDT"}]
*/

function main() {
    var chartCfg = {
        grid: {
            show: true,
            // Grid horizontal line
            horizontal: {
                show: true,
                size: 2,
                color: '#FF0000',
                // 'solid'|'dash'
                style: 'dash',
                dashValue: [2, 2]
            },
   	        // Grid vertical line
            vertical: {
                show: true,
                size: 2,
                color: '#32CD32',
                // 'solid'|'dash'
                style: 'solid',
                dashValue: [2, 2]
            }
        },
    }

    var c = KLineChart(chartCfg)

    // Strategy main loop
    while(true) {
        // Polling interval
        Sleep(500)

        // Obtain K-line data
        var bars = _C(exchange.GetRecords)
        bars.forEach(function(bar, index) {
            c.begin(bar)
            c.close()
        })

        // Strategy trading logic
        // ...
        // ..
    }
}
Example of chart configuration style
It can be used to refer to the chart configuration style settings.
{
// Gridlines
grid: {
show: true,
// Grid horizontal line
horizontal: {
show: true,
size: 1,
color: '#393939',
// 'solid'|'dash'
style: 'dash',
dashValue: [2, 2]
},
// Grid vertical line
vertical: {
show: false,
size: 1,
color: '#393939',
// 'solid'|'dash'
style: 'dash',
dashValue: [2, 2]
}
},
// Candlestick chart
candle: {
// The distance between the top and bottom of the candlestick chart, greater than 1 is the absolute value, greater than 0, and 1 is the proportion
margin: {
top: 0.2,
bottom: 0.1
},
// Type of Candlestick Charts 'candle_solid'|'candle_stroke'|'candle_up_stroke'|'candle_down_stroke'|'ohlc'|'area'
type: 'candle_solid',
// Candle pillar
bar: {
upColor: '#26A69A',
downColor: '#EF5350',
noChangeColor: '#888888'
},
// Area map
area: {
lineSize: 2,
lineColor: '#2196F3',
value: 'close',
backgroundColor: [{
offset: 0,
color: 'rgba(33, 150, 243, 0.01)'
}, {
offset: 1,
color: 'rgba(33, 150, 243, 0.2)'
}]
},
priceMark: {
show: true,
// Highest price marker
high: {
show: true,
color: '#D9D9D9',
textMargin: 5,
textSize: 10,
textFamily: 'Helvetica Neue',
textWeight: 'normal'
},
// Lowest price marker
low: {
show: true,
color: '#D9D9D9',
textMargin: 5,
textSize: 10,
textFamily: 'Helvetica Neue',
textWeight: 'normal',
},
// Latest price marker
last: {
show: true,
upColor: '#26A69A',
downColor: '#EF5350',
noChangeColor: '#888888',
line: {
show: true,
// 'solid'|'dash'
style: 'dash',
dashValue: [4, 4],
size: 1
},
text: {
show: true,
size: 12,
paddingLeft: 2,
paddingTop: 2,
paddingRight: 2,
paddingBottom: 2,
color: '#FFFFFF',
family: 'Helvetica Neue',
weight: 'normal',
borderRadius: 2
}
}
},
// Tips
tooltip: {
// 'always' | 'follow_cross' | 'none'
showRule: 'always',
// 'standard' | 'rect'
showType: 'standard',
labels: ['time', 'open', 'close', 'high', 'low', 'volume'],
values: null,
defaultValue: 'n/a',
rect: {
paddingLeft: 0,
paddingRight: 0,
paddingTop: 0,
paddingBottom: 6,
offsetLeft: 8,
offsetTop: 8,
offsetRight: 8,
borderRadius: 4,
borderSize: 1,
borderColor: '#3f4254',
backgroundColor: 'rgba(17, 17, 17, .3)'
},
text: {
size: 12,
family: 'Helvetica Neue',
weight: 'normal',
color: '#D9D9D9',
marginLeft: 8,
marginTop: 6,
marginRight: 8,
marginBottom: 0
}
}
},
// Technical indicators
technicalIndicator: {
margin: {
top: 0.2,
bottom: 0.1
},
bar: {
upColor: '#26A69A',
downColor: '#EF5350',
noChangeColor: '#888888'
},
line: {
size: 1,
colors: ['#FF9600', '#9D65C9', '#2196F3', '#E11D74', '#01C5C4']
},
circle: {
upColor: '#26A69A',
downColor: '#EF5350',
noChangeColor: '#888888'
},
// Latest value marker
lastValueMark: {
show: false,
text: {
show: false,
color: '#ffffff',
size: 12,
family: 'Helvetica Neue',
weight: 'normal',
paddingLeft: 3,
paddingTop: 2,
paddingRight: 3,
paddingBottom: 2,
borderRadius: 2
}
},
// Tips
tooltip: {
// 'always' | 'follow_cross' | 'none'
showRule: 'always',
// 'standard' | 'rect'
showType: 'standard',
showName: true,
showParams: true,
defaultValue: 'n/a',
text: {
size: 12,
family: 'Helvetica Neue',
weight: 'normal',
color: '#D9D9D9',
marginTop: 6,
marginRight: 8,
marginBottom: 0,
marginLeft: 8
}
}
},
// x-axis
xAxis: {
show: true,
height: null,
// x-axis line
axisLine: {
show: true,
color: '#888888',
size: 1
},
// x-axis split text
tickText: {
show: true,
color: '#D9D9D9',
family: 'Helvetica Neue',
weight: 'normal',
size: 12,
paddingTop: 3,
paddingBottom: 6
},
// x-axis split line
tickLine: {
show: true,
size: 1,
length: 3,
color: '#888888'
}
},
// y-axis
yAxis: {
show: true,
width: null,
// 'left' | 'right'
position: 'right',
// 'normal' | 'percentage' | 'log'
type: 'normal',
inside: false,
reverse: false,
// y-axis line
axisLine: {
show: true,
color: '#888888',
size: 1
},
// y-axis split text
tickText: {
show: true,
color: '#D9D9D9',
family: 'Helvetica Neue',
weight: 'normal',
size: 12,
paddingLeft: 3,
paddingRight: 6
},
// y-axis split line
tickLine: {
show: true,
size: 1,
length: 3,
color: '#888888'
}
},
// Split line between charts
separator: {
size: 1,
color: '#888888',
fill: true,
activeBackgroundColor: 'rgba(230, 230, 230, .15)'
},
// Crosshair
crosshair: {
show: true,
// Horizontal line and text of crosshair
horizontal: {
show: true,
line: {
show: true,
// 'solid'|'dash'
style: 'dash',
dashValue: [4, 2],
size: 1,
color: '#888888'
},
text: {
show: true,
color: '#D9D9D9',
size: 12,
family: 'Helvetica Neue',
weight: 'normal',
paddingLeft: 2,
paddingRight: 2,
paddingTop: 2,
paddingBottom: 2,
borderSize: 1,
borderColor: '#505050',
borderRadius: 2,
backgroundColor: '#505050'
}
},
// Vertical line and text of crosshair
vertical: {
show: true,
line: {
show: true,
// 'solid'|'dash'
style: 'dash',
dashValue: [4, 2],
size: 1,
color: '#888888'
},
text: {
show: true,
color: '#D9D9D9',
size: 12,
family: 'Helvetica Neue',
weight: 'normal',
paddingLeft: 2,
paddingRight: 2,
paddingTop: 2,
paddingBottom: 2,
borderSize: 1,
borderColor: '#505050',
borderRadius: 2,
backgroundColor: '#505050'
}
}
},
// Graph
shape: {
point: {
backgroundColor: '#2196F3',
borderColor: '#2196F3',
borderSize: 1,
radius: 4,
activeBackgroundColor: '#2196F3',
activeBorderColor: '#2196F3',
activeBorderSize: 1,
activeRadius: 6
},
line: {
// 'solid'|'dash'
style: 'solid'
color: '#2196F3',
size: 1,
dashValue: [2, 2]
},
polygon: {
// 'stroke'|'fill'
style: 'stroke',
stroke: {
// 'solid'|'dash'
style: 'solid',
size: 1,
color: '#2196F3',
dashValue: [2, 2]
},
fill: {
color: 'rgba(33, 150, 243, 0.1)'
}
},
arc: {
// 'stroke'|'fill'
style: 'stroke',
stroke: {
// 'solid'|'dash'
style: 'solid',
size: 1,
color: '#2196F3',
dashValue: [2, 2]
},
fill: {
color: '#2196F3'
}
},
text: {
style: 'fill',
color: '#2196F3',
size: 12,
family: 'Helvetica Neue',
weight: 'normal',
offset: [0, 0]
}
},
annotation: {
// 'top' | 'bottom' | 'point'
position: 'top',
offset: [20, 0]
symbol: {
// 'diamond' | 'circle' | 'rect' | 'triangle' | 'custom' | 'none'
type: 'diamond',
size: 8,
color: '#2196F3',
activeSize: 10,
activeColor: '#FF9600'
}
},
tag: {
// 'top' | 'bottom' | 'point'
position: 'point',
offset: 0,
line: {
show: true,
style: LineStyle.DASH,
dashValue: [4, 2],
size: 1,
color: '#2196F3'
},
text: {
color: '#FFFFFF',
backgroundColor: '#2196F3',
size: 12,
family: 'Helvetica Neue',
weight: 'normal',
paddingLeft: 2,
paddingRight: 2,
paddingTop: 2,
paddingBottom: 2,
borderRadius: 2,
borderSize: 1,
borderColor: '#2196F3'
},
mark: {
offset: 0,
color: '#FFFFFF',
backgroundColor: '#2196F3',
size: 12,
family: 'Helvetica Neue',
weight: 'normal',
paddingLeft: 2,
paddingRight: 2,
paddingTop: 2,
paddingBottom: 2,
borderRadius: 2,
borderSize: 1,
borderColor: '#2196F3'
}
}
}
Doesn’t this make strategy drawing design easier?