I. Preface
Before starting this article, let me start with my self-introduction. Qu Banzhu is my pseudonym, and I hope to describe the blockchain by means of crosstalk. I have been engaged in embedded development for 15 years. In the last two years, I have gained a deeper understanding of digital currency by studying the application of blockchain in the Internet of Things. At the same time, I found the FMZ Quant platform in the process of digital currency trading. Although I heard about Bitcoin early, I really paid attention to it, that is, in the last two years, so I missed the boom and slump in 2017 and 2018. Looking back, and referring to the experience of predecessors, I believe that to make achievements in the field of digital currency investment, one or two projects must be selected, and a large amount of money must be invested in their early years. I think that we can start with quantitative trading of digital currency. Because digital currency is a 24-hour transaction, and the capital threshold is low, there is no stop limit, which is very suitable for program trading and the rolling development of small funds.
The advantage of quantitative trading is that it can extract some operation ideas and execute them through procedures. In this way, it prevents people’s mood from being affected by the violent market fluctuations, and they misoperate or do not operate. The program monitoring is also convenient to find the market in time. At the same time, whether some trading ideas are reasonable can also be backtested through the FMZ Quant platform to eliminate some bad strategies in time. To conduct quantitative trading means to find market bugs and to cope with the strategic competition of quantitative peers. That is to say, quantitative trading is not done overnight. It needs to “keep pace with the times” with the market and develop new strategies in combination with new situations. Because I have proficient programming ability but weak financial knowledge, the following article discusses the strategy conceived by myself and has carried out several iterations. I also hope you have good strategies that can be discussed and realized with me.
II. Practice
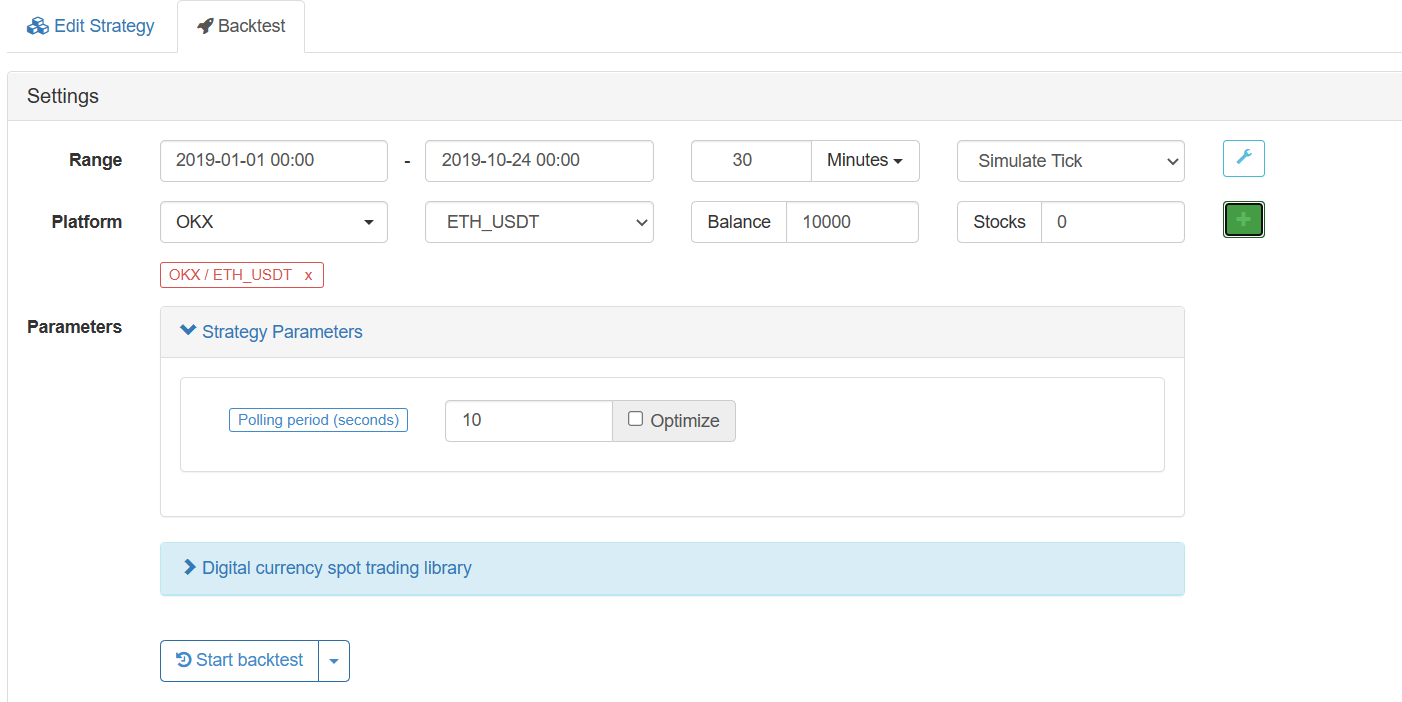
In order to accommodate a relatively large amount of funds, and in order to better monitor and facilitate manual intervention, I mainly adopted daily trading. In order to avoid the violent fluctuation of BTC, I chose ETH as the main currency. Taking 2019 as the backtest benchmark, the reason is that in the first half of 2019, there was a unilateral rise, and in the second half of 2019, there was a unilateral decline, which basically took into account the bull market and bear market. In this way, the best situation achieved an annualized interest rate of 210 and a rollback of 16.4%. Because it is not high-frequency trading, and because it is spot trading, there is no short selling, so there is still much room for improvement in this indicator in the future.
First, we begin our quantitative journey with a strategy conceived by myself: the transition strategy of three periods in large, medium and small. In general, the large period indicates the market direction, the medium period indicates the current operating period, and the small period indicates the trend stop signal. When you enter the market, as long as you have seen the status of the three periods of large, medium and small, you can adopt ever-changing strategies to deal with the complex market. If your operation period frequency is several times a day, you can select a daily line for a large period, 4 hours for a medium period and 30 minutes for a small period; If your operation period frequency is dozens of times a day, you can choose 4 hours for a large period, 30 minutes for a medium period, and 5 minutes for a small period; The difference between the last period and the next period is always 6-8 times.
Then we list the relationship between the K-line and the Bollinger Bands in each period. There are eight states in total. In three periods, there are 8X8X8=512 states. These 512 states are enough to deal with all possible markets. Programmers with proficient technical skills can pre design the optimal next single point and stop loss point for each state. In order to have a basis for discussion, I have also made the strategy public on the FMZ platform. Click to view it. Welcome to improve on this basis.
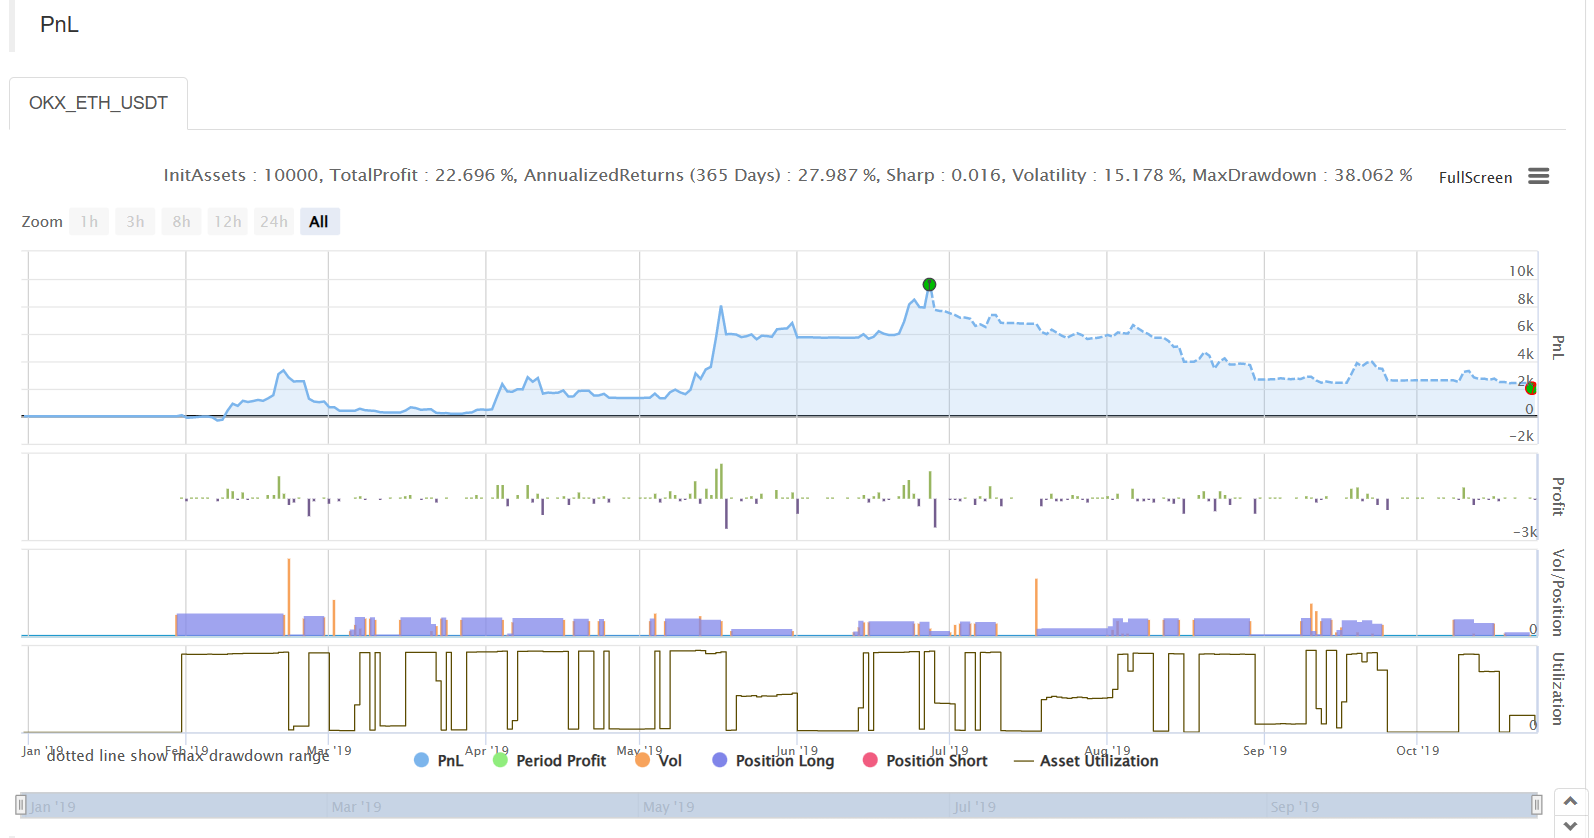
Then we can backtest it. We can see that the annualized interest rate is 29, and the withdrawal rate is a little high, reaching 36%. We download the log and analyze the rollback, which is the advantage of the FMZ platform.
III. Improvement
The main reasons are as follows:
Although the structure of large, medium and small periods is relatively good, the strategy of how small periods affect medium period is not easy to conceive. It can be simplified first and then supplemented later;
When the market goes short, we should resolutely abandon our position.
The directional role of the five-day EMA is very important, which is not reflected in the strategy.
The rapid decline outside the Bollinger Bands should be sold.
When the increase falls below, the profit and loss should be stopped in time.
We put the reason for each iteration, the running period, the number of annualized interest rate, rollback, and transactions in the file name, and mapped the logs to quickly find the previous version for correction. Good habits can promote us to make progress. It can be seen that the process of quantification is also a process of correcting our wrong strategies to make them more powerful.
In order to deal with various situations of profit-stop and loss-stop, I also added some variables. Considering the “hot and cold” conditions of the market, a concept of Feel is added. The so-called “hot” is that after selling, the price has jumped again and had to buy; Cold is the opposite. When they are different, the transition parameters are also different. In addition, a concept of panic line is added. When the high level breaks through the previous high and continues to rise, or when the low level breaks through the previous low and continues to fall, it will trigger additional buying or selling. After targeted improvement and iteration for dozens of times, we finally achieved an annualized interest rate of 210 to 16.4, and the number of transactions will also decrease, as shown below:
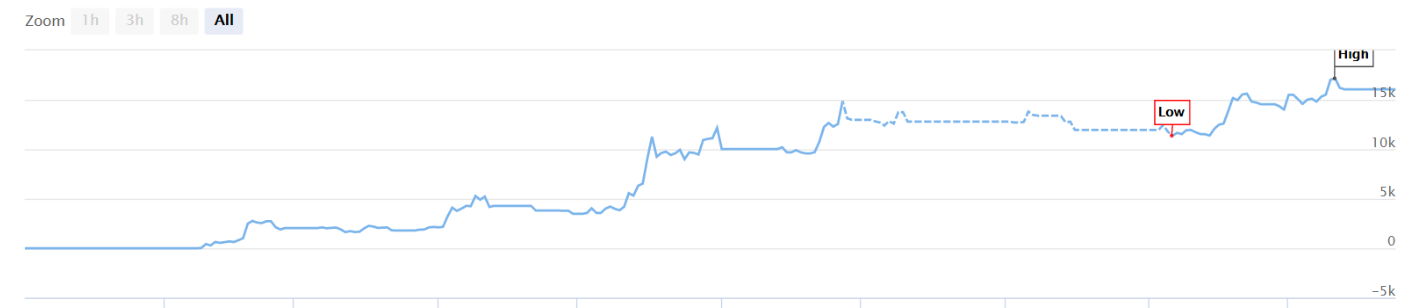
At the same time, we also observed that as of June 27, there has been a profit of 14,872, the next four months were only 2,000-3,000. The reason is that in the first half of 2019, the market was on the rise, increased more than 200%, and in the second half of 2019, the market was on the decline, decreased 70%; So as a good strategy, when it increases, you need to absorb the strength of the rise with large positions. When it decreases, you need to sell short positions in time and try to see more than you can change. Of course, the above experience is that when it is impossible to go short, otherwise the program will be more complex, and some unexpected situations should be taken into account, which needs to be improved later.
IV. Summary
The above strategy subsequent optimization:
- 1. Use a smaller period as the trading period, such as 1 hour, which requires repeated adjustment and optimization of parameters;
- 2. You can go short by contract.
The above is the journey of FMZ Quant. If you are also interested in quantification, go to the FMZ platform to explore with me!