Origin of the box theory
The first time I came across the box theory was seen in the book “HOW I MADE $2,000,000 IN THE STOCK MARKET”. As a dancer, Nicolas Darvas invested his money in stocks after every global tour, and he earned $2,000,000 in just a few years. The method he used was box theory.
This was an incredible thing at that time, so that Time magazine also reported on him. Later, he wrote several books about his trading history and trading methods. Box theory is also mentioned in “Wall Street – The Other Las Vegas”.
What is the box theory?
The so-called box, which can also be called a pattern. Its theoretical basis draws on the support line and resistance line. Generally, when the price rises to the previous high point, the selling pressure will cause the price to fall back, and when the price falls to the previous low point, the buying pressure will cause the price to rise. If the price moves up and down repeatedly in this way, a box theory can be formed according to the high and low points of the historical price for a period of time.
The concept of a box is an artificial subjective definition. In theory, the box has the function of resistance and support, and the price will always move up and down in the box. Once the price breaks through the upper track of the box, it means that it is a more powerful long position force than the resistance line. In the future, the price may form a long position trend and rise to the expected another box. On the contrary, once the price breaks through the lower track of the box, it means that this is a stronger short position force than the support line. In the future, the price may form a short position trend and fall to the expected another box.
The essence of box theory
The idea of box theory is to measure the possible future price through the price box. When the price breaks through the top of the box, it indicates that the price will reach a higher box. On the contrary, when the price falls below the bottom of the box, it indicates that the price will reach a lower box.
Therefore, when the price breaks through the top of the box effectively, the previous resistance line will become the support line, and the price will enter the rising period or enter a higher box in the future. In the same way, when the price breaks through the bottom of the box effectively, the previous support line will become the resistance line, and the price will enter a downward period in the future, or enter a lower box.
Of course, in fact, the box pattern in the market is not four-square like a box. We know that the price trend is not always regular. Sometimes the box shape presents a standard W shape or M shape, but sometimes it also presents a pattern of high in front, or low in front, or even a running flag pattern.
Formula and strategy logic of box theory
- Support price = lowest closing price in N period
- Resistance price = highest closing price in N period
- Box height = resistance price – support price
Box theory MyLanguage
N=50;
PRICE:=(OPEN+HIGH+LOW+CLOSE*2)/5;
UPPERBAND:REF(HHV(PRICE,N),1);
LOWERBAND:REF(LLV(PRICE,N),1);
C>=UPPERBAND,BPK;
C<=LOWERBAND,SPK;
WWW.FMZ.COM:C,NODRAW;
MID=(UPPERBAND+LOWERBAND)/2;
C<MID||C<LLV(PRICE,N/2),SP;
C>MID||C>HHV(PRICE,N/2),BP;
AUTOFILTER;
The above is the trading strategy based on box theory, it supports commodity futures and digital currency. When calculating the top and bottom of the box, there is no maximum price and minimum price, but the average value of the opening price + maximum price + minimum price + 2 times of the closing price is used. The advantage of this is that it can filter the extreme prices generated by some extreme quotes.
Strategy backtesting
In order to get closer to the real trading environment, we used two smallest fluctuations for opening and closing positions and two times of the commissions for stress testing. The test environment is as follows:
- Market species: iron ore index
- Trade species: main iron ore
- Time: October 23, 2013 ~ July 18, 2019
- Period: hour line
- Slippage: 2 smallest fluctuations for opening and closing positions
- Commission: 2 times the exchange
Capital curve
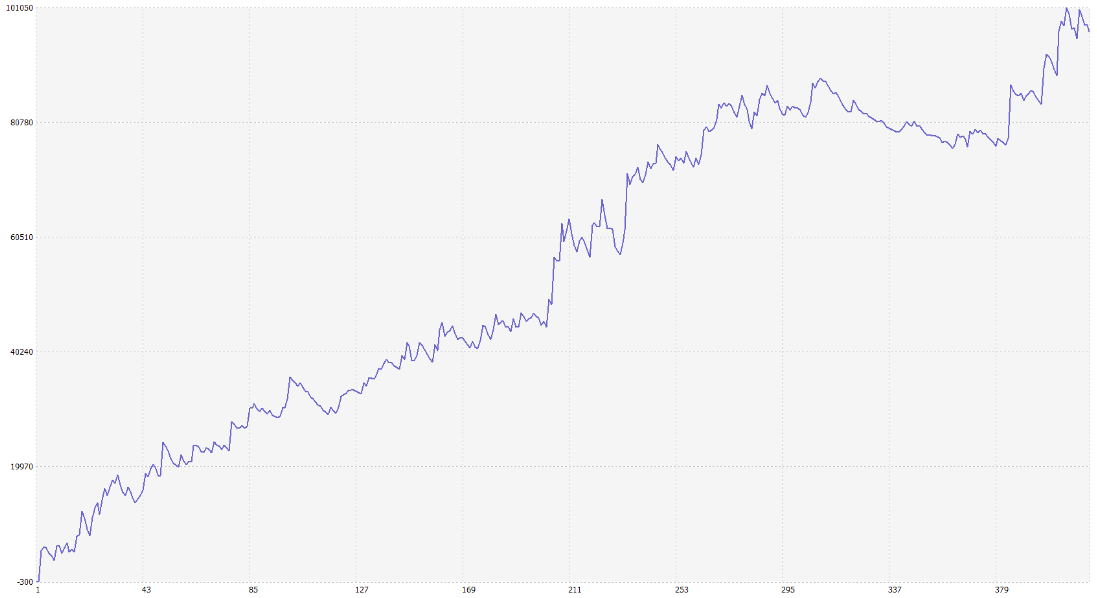
On the whole, the capital curve of the backtest is steadily upward. Whether in the rising market or in the falling market, the strategy performs well when the market moves smoothly. Basically, every large market trend can make profits. In addition, it can also better control the withdrawal of the capital curve during the period of market volatility.
Copy the strategy source code
The strategy source code has been published at: https://www.fmz.com/strategy/158088. There is no need to configure, you can copy and backtest online directly.
Summary
As an old trading method, the box theory still maintains its vitality in today’s domestic commodity futures and digital currencies. Although the strategy in this article is relatively simple, it is also applicable in the field of traders. A correct strategic framework does not care about the gains and losses of each transaction, from a global perspective, as long as this strategy is consistent with the small losses and the great profits, it can achieve stable profits in the long run.