In the last article, we talked about programmed trading scripts. In fact, the trading strategy is a trading script program. The article mainly talks about the need for a hardware carrier for the trading script program (where the program runs), and the script trading program can be written in that computer programming language (listing the three programming languages used in FMZ Quant Trading Platform; of course, you can use any programming language to implement strategies in the programmed trading). In this article, we continue to discuss the quantification of the cryptocurrency circle and understand the knowledge of it.
Programmed Trading Script
- Trading strategy type
Novices who are new to programmed trading and quantitative trading may be confused by various terms such as trend strategy, arbitrage strategy, high-frequency strategy, grid strategy, etc. In fact, the common types of strategies in programmed trading and quantitative trading are simply in several directions.- Arbitrage strategy
Simply put, a strategy that basically holds long positions while holding short positions can be classified as an arbitrage strategy. There are many specific types of it, such as spot cross-market, futures cross-period, futures and spot arbitrage, and cross-symbol arbitrage, etc. - Trend strategy
Simply put, it is the strategy of tracking the trend and placing a single position, such as dual moving average, MACD and other strategies. - Return strategy
For example, the grid strategy, earning the return from price fluctuations in volatile markets. - High-frequency strategy
To be simply, it is a strategy to conduct high-frequency trading through some algorithms to discover market microstructure, rules, opportunities, etc.
- single-symbol strategy
That is to say the strategy can only operate one symbol, such as making a BTC trade or ETH trade. - multi-symbol strategy
Simply speaking, it is to operate multiple symbols by one strategy logic. - multi-account strategy
Simply put, it is to configure multiple exchange objects on a bot (the concept of a platform has been introduced in the previous article, and an exchange object configured with an API KEY represents a platform account). For example, in some order-supervising strategies, multiple accounts will follow an operation together (which may be the accounts of the same platform or different platforms). In short, multiple exchange objects (accounts) are managed in one bot. - multi-logic strategy
For example, MACD strategy, moving average strategy, grid strategy, etc. are designed at the same time on a bot (of course, it is to operate different exchange objects, and the exchange objects with the same operation depends on whether the specific strategy is logically conflicting)
- Arbitrage strategy
- Platform API Interface
How does the programmed trading script operate the platform account? The answer is through the API interface opened by the platform.
So what types of interfaces are open to platforms? In the last article, we talked about that platforms generally have REST and Websocket interfaces in the “Platform” section. Here we add some concepts from the aspect of strategy procedures. The platform interfaces are divided according to whether it is verified (both REST and Websocket), namely verified and non-verified.- Interfaces that do not need verification
Generally, they are referred as “public interfaces”; this type of interfaces do not require verification ofAPI KEY(if you do not remember what API KEY is, you can turn to the previous article). This type of interface is generally a market interface, such as querying depth market quotes, K-line data, funding rates, the information about trading symbols, platform server timestamps, etc.
Simply put, the interface that is basically unrelated to your account can be roughly determined to be a public interface (no verification required).
On FMZ Quant Trading Platform, when calling an unverified API function (encapsulating the platform’s unverified interface; public interface), even if the API KEY configuration is incorrect, the data returned by the interface can be obtained normally. (no verification required) - Interfaces that need verification
Simply put, they are the interfaces that need to be verified (by API KEY). This type of interface is called a private interface. This type of interface is usually related to some operations or information of your account, such as querying account assets, account positions, pending orders, transfers, currency conversion, leverage adjustment, and position mode setting, etc.
These operations must be verified.On FMZ Quant, when calling the API functions that need verification (the private interfaces, which are encapsulated and need the platform verification). If the configuration of API KEY is wrong, calling this kind of function will report an error, and return null.
exchange.IOfunction on the FMZ Quant (for details, see FMZ Quant trading platform API documentation: https://www.fmz.com/api#exchange.io…). There are also some practical IO example strategies in the “Square” of FMZ Quant. - Interfaces that do not need verification
Can all API functions in the FMZ API documentation make a network request?
We need to say that the platform APIs have a limit for access frequency (for example, 5 times in 1 second). The access cannot be too frequent, or the error of http 429 will be reported, and the access will be rejected (most of platforms report 429). Therefore, calling the encapsulated platform interfaces on FMZ Quant also has the limit, but calling the API functions that do not make network requests has no such limit.
Not all API functions on FMZ Quant can make network requests; some API functions on FMZ only modify some local settings, such as setting the current trading pair, contract code and indicator calculation function, as well as acquiring exchange object name, etc.
Basically, from the use of the a function, you can determine whether a network request will be made; as long as it is to acquire the platform data, or operate a platform account, a network request will be made; these interfaces all need to pay attention to the invocation frequency.
Let’s talk about several common problems and experience of using API functions on FMZ Quant.
Fault tolerance
This is the most common error, which has troubled countless beginners. Often, the strategy backtest is good and everything is normal. Why does the bot work abnormally after the bot runs for a while (which may be triggered at any time)?
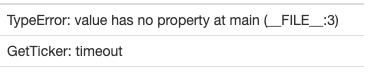
When writing a strategy, for the data returned by the interface needs to be verified. For example, the code of getting ticker on FMZ Quant (which is the same as writing your own program to directly access the platform interface): var ticker = exchange.GetTicker(); if we need to use the the data of Last (the latest price) in the variable ticker (you can refer to the return structure of the function GetTicker), we need to obtain the data (what is newPrice? new: the latest; Price: price; that’s right, combine them up!)
Now, it is fine if the function GetTicker() returns the normal data; if there is a timeout request, network error, platform pulling off the cable, cables broken by digging, or kids turning off the electricity switch, the function GetTicker() will return null. At the moment, the value of ticker is null; when I access the Last of it, the strategy program will be stopped by program exception.
From that, it seems that the failure of the interface call (the invocation of GetTicker fails and returns null) is not the direct cause of the stop of the strategy bot (the direct cause is that an attribute of a null variable is accessed). The situation that the failure of the interface call reports an error will not causes the bot to stop (emphasis added here).
So, what should we do to avoid the abnormal stop of bot?
The answer is to do fault tolerance process to the data returned by interfaces; it is very simple, and you only need to judge whether the returned data is null (here take JavaScript as an example, for the other languages are similar).
Write a small code segment (which is only for instruction, and cannot be directly run!)
var ticker = exchange.GetTicker()
if (ticker) {
    var newPrice = ticker.Last
    Log("Print the latest price:", newPrice)
} else {
    // data is null, so no operation will make no problem
}
Not only the GetTicker interface needs to do fault-tolerant processing, but the interface with network requests needs to be do the fault-tolerant processing for the return value (if you use the return value of the function)
There are many fault tolerance methods. You can use the _C() function (refer to the FMZ API documentation) to write your own fault-tolerant function and design your own fault-tolerant mechanism and logic.
Regarding the use of the _C() function, many new students are also very likely to use it incorrectly. Note that the parameters of the _C() function is a function reference, not a function call. To be simple:_C(funcName, param1, param2); the call is correct; funcName does not have parentheses, and param1 and param2 are the parameters to be imported to the function funcName._C(funcName(param1, param2)); the call is wrong; usually if a newbie doesn’t read the FMZ API documentation carefully, it will be written like this.
Spot market buy order amount
Beginners also easily to make mistakes in the order amount of the spot market buy order. As mentioned in the previous article, the order amount of the spot market buy order is usually the money amount (only a few of platforms may have other settings, and generally these special platform settings will be explained in the FMZ API documentation). For example, I used OKEX V5 simulated bot to test:
Set the trading pair as: LTC_USDT
function main() {
    exchange.IO("simulate", true)   // switch to OKEX simulated bot
    exchange.Buy(-1, 1)             // the price is -1, representing the placed order is market order; the amount of 1 means the order amount of 1 USDT
}
Since platforms generally have a limit on the order amount, orders with an amount smaller than the limit will not be placed (for example, Binance Spot requires only orders with an amount greater than 5USDT can be placed successfully). Therefore, placing an order like this will report an error:
error Buy(-1, 1): map[code:1 data:[map[clOrdId: ordId: sCode:51020 sMsg:Order amount should be greater than the min available amount. tag:]] msg:]
Futures order direction
When doing futures strategies, beginners often make mistakes in the order direction. Taking the example of writing strategies on FMZ Quant, let’s first look at the description on the API documentation:
https://www.fmz.com/api#exchange.setdirection…
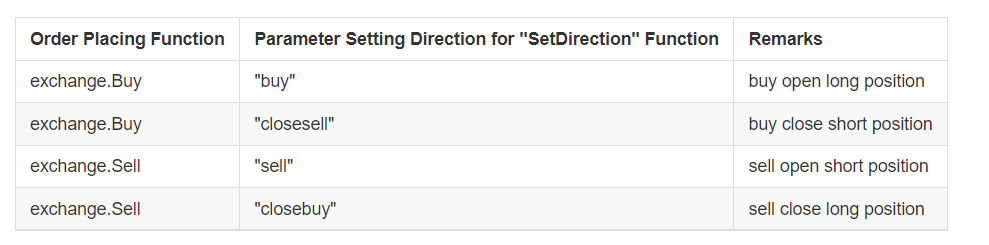
Because the order placing function only has Buy and Sell. However, futures (of course, there is no problem for the spot, for the spot only has buy and sell) has the directions of opening long, closing long, opening short, and closing short, so obviously “Buy” and “Sell” cannot express operations in so many directions, then it is necessary to introduce the function exchange.SetDirection() of setting futures trading directions.
On FMZ, exchange.SetDirection("buy") (which first sets the direction first) is used together with exchange.Buy, which means that the order placed is an order to open long positions.
And so on:
Use exchange.SetDirection("sell") and exchange.Sell together, which represents the placed order is an order to open short positions.
Use exchange.SetDirection("closebuy") and exchange.Sell together, which represents the placed order is an order to close long positions.
Use exchange.SetDirection("closesell") and exchange.Buy together, which represents the placed order is an order to close short positions.
The beginners, usually will use exchange.SetDirection("sell") and exchange.Buy together, or other wrong combinations. Then, an error will be reported (an error cannot be reported in the backtest, but that is obviously a logic error, which cannot be ignored by obsessive-compulsive people like me.)
Here is another mistake usually made by beginners.
function main() {
    exchange.SetContractType("quarter")   // set the current contract to a quarterly contract
    exchange.SetDirection("sell")
    var id = exchange.Sell(-1, 1)
    Log("placed market order, executed, get positions", exchange.GetPosition())
    exchange.SetDirection("closebuy")   // use closebuy and Sell together, yes, no problem
    exchange.Sell(-1, 1)
}
When it comes to here, you might ask:” I have positions, and use closebuy and Sell together, so why an error is reported and I cannot close positions?” I would say:”wrong direction to close positions! You closed long positions.”
Moreover, the error can be in another situation: the setting of close position direction is correct, the use of order placing function is also correct, and you also hold the positions in the direction, but the error is still reported.
The reason might be: your program has placed many orders, the orders at first are not executed, and the orders of close positions are now in the market and wait for execution. At the time, the program continues to close positions, which will prompt an error of exceeding close positions.
Log export & trading information display
Designing and writing programmed and quantitative trading strategies is inseparable from the design of human-computer interactions, such as “data display” and “operation logs export”. Usually use the local programming language to write bot scripts and strategy programs. Directly use the output function of the current language.
For example:
python uses print.
javascript uses console.log.
Golang uses fmt.Println().
C++ uses cout.
Let’s talk about the information display on FMZ. On FMZ Quant, there are mainly two places to display information.
Status bar
After the bot is started, the bot page is shown as follows:
The display part is the status bar information. The status bar is mainly used to display some real-time changing data (because real-time changes need to be observed in real time, and cannot be printed as a log every time, so this type of data can be displayed in the status bar. If print log of each one, there will be a lot of meaningless repeated data, affecting the query).
The data displayed on the status bar uses the LogStatus function. For details, please refer to the FMZ API documentation.
Log bar
It is also on the bot page, as is shown in the following picture:

The display part is the log bar. The log bar is mainly used to permanently record certain data at a certain time, or record an operation of a certain strategy at a certain time.
Logs are divided into various types:
Among FMZ API functions, functions that can generate log output, such as Log(…), exchange.Buy(Price, Amount), exchange.CancelOrder(Id), etc., can be followed by some additional output parameters after the necessary parameters, such as: exchange. CancelOrder(orders[j].Id, orders[j]); it is to additionally output the order information when the order of orders[j] is canceled.
function main() {
    Log("data1", "data2", "data3", "...")
    var data2 = 200
    var id = exchange.Sell(100000, 0.1, "additional data1", data2, "...")
    exchange.CancelOrder(id, "additional data1", data2, "...")
    LogProfit(100, "additional data1", data2, "...")
}
Use of indicator functions
Before talking about the indicator function, let’s first understand what an indicator is. Simply put, it is a line such as moving average, MACD, or ATR.
Q:how are those indicators generated?
A: they surely are generated by calculations.
Q: What are they calculated on?
A: K-line data.
Q: Can you make an example?
A: Taking the simplest moving average indicator as an example. If we use the daily K-line (that is, a yang line or yin line represents a day) data as the data source for the indicator calculation. The moving average indicator parameter is 10, then the calculated moving average indicator is the 10-day moving average.
Q: if the number of K-line BAR is less than 10, can the moving average indicator be calculated?
A: Not only the moving average indicator cannot be calculated, but any indicator cannot calculate the effective indicator value when the number of K-line data BAR does not meet the indicator period parameter, and the corresponding position of the calculated array will be filled with empty values, such as null displayed when the JavaScript strategy prints the calculated indicator data.
There is a teaching example in the Square: https://www.fmz.com/strategy/125770
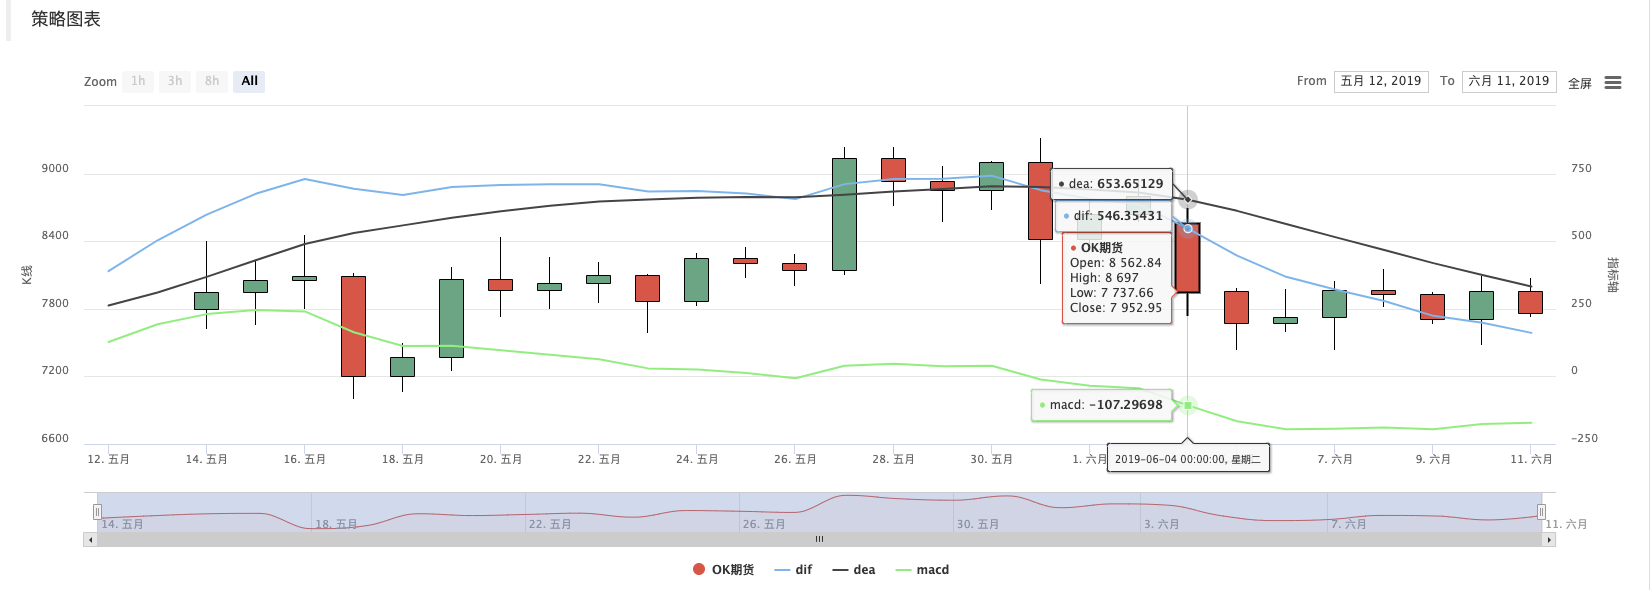
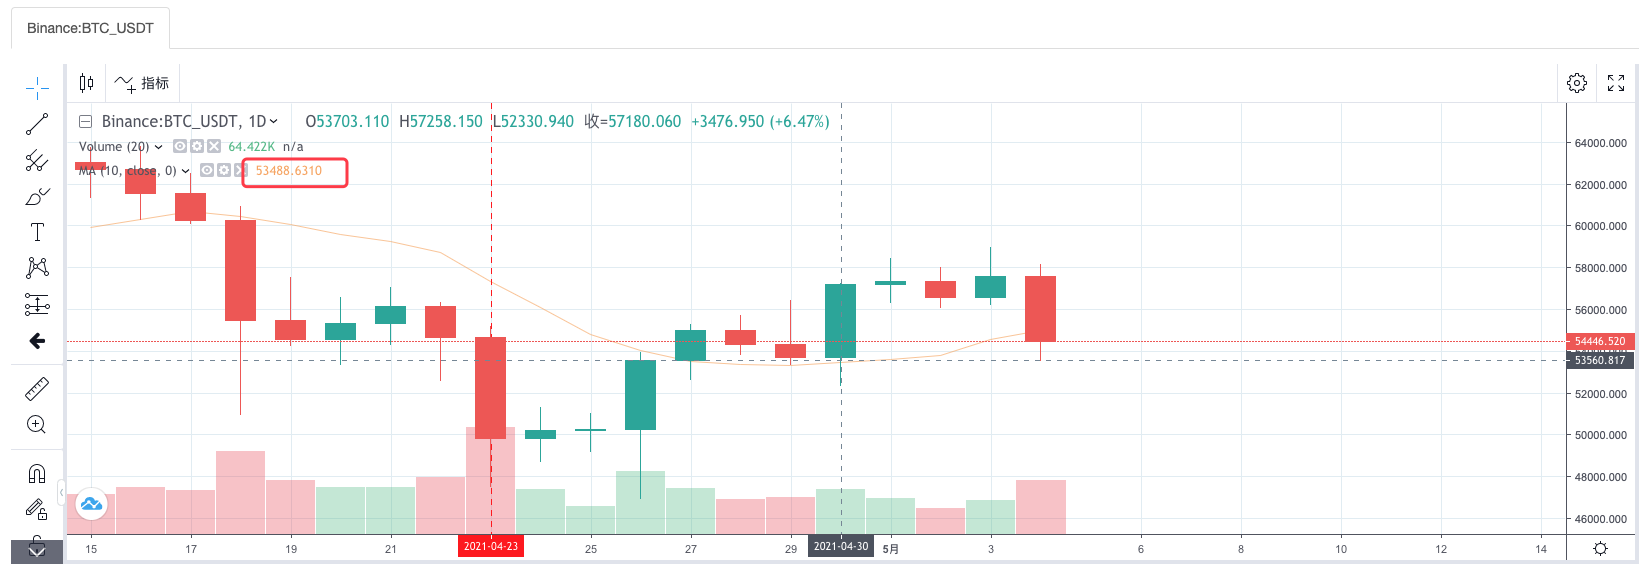
Backtest this teaching example strategy, and you can see the chart generated by the backtest system and the 10-period moving average:
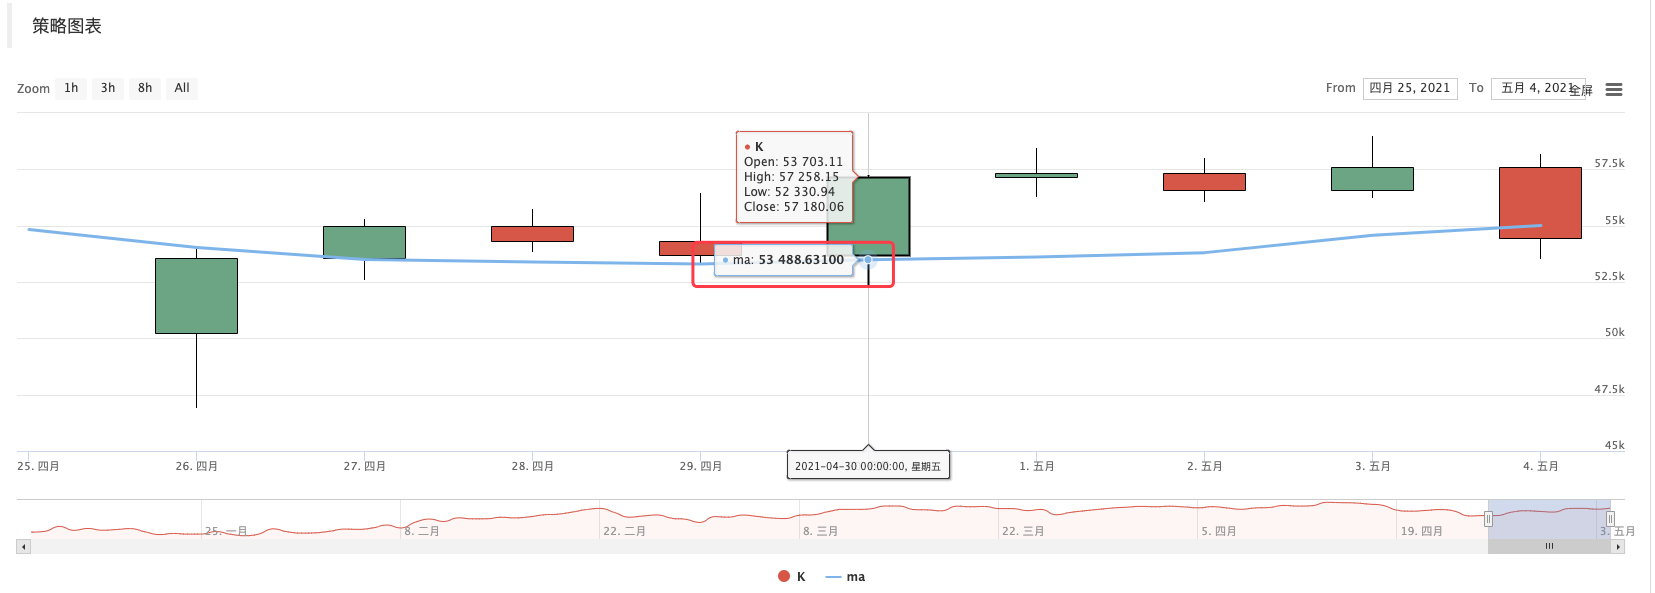
By strategy custom drawing, drawn K-line and moving average chart:
Q: what if I want to use a 10-hour moving average?
A: use the K-line data of an hourly period.
Simply speaking, the K-line we see is an array after we digitize it (if you do not understand the concept of array, you can search it on Baidu), and each element of the array is a K-line bar, which is arranged in order. The first element in the array is the farthest from the current time, and the last element of the array is the closest to the current time.
Usually the last bar of the K-line data is the bar of the current period, which changes in real time and is not completed (you can observe the changes by logging in to a platform page and observing its K-line). The calculated indicators are also in one-to-one correspondence with the K-line bars. In the above example, you can see that an indicator value corresponds to a K-line bar. Note that the last K-line bar changes in real time, and the calculated indicator will also change with the change of the K-line bar.
On FMZ Quant Trading Platform, you can use the TA library (the library implemented by FMZ, integrated in the docker, and can be used directly in various languages) or talib (the old famous indicator library “talib”, integrated in JS, C++; Python needs to be install addtionally).
For example, the calculation of the average in the above example:
Use FMZ TA library:
function main() {
    var records = exchange.GetRecords()
    var ma = TA.MA(records, 10)
    Log(ma)       // print average
}
Use talib:
function main() {
    var records = exchange.GetRecords()
    var ma = talib.MA(records, 10)
    Log(ma)       // print average
}
The calculated index data ma is an array, and each element corresponds to the K-line array (records) one by one, that is, ma[ma.length -1] corresponds to records[records.length - 1], and so on.
It is the same for other more complicated indicators, and you need to pay attention to indicators such as MACD.
var macd = TA.MACD(records) // In this way, only the K-line data is passed in, and no indicator parameters are passed in. The indicator parameters use the default values, and that is the same for other indicator functions
At this time, the variable macd is a two-dimensional array (you can Baidu it, if you don’t understand the concept). A two-dimensional array is simply an array, and each element of it is also an array.
Q: why macd indicator data is a two-dimensional array?
A: Because the macd indicator is composed of two lines (dif line and dea line) and a set of volume bars (the macd volume bar data, in fact, can also be regarded as a line). So the macd variable can be split into:
var dif = macd[0]
var dea = macd[1]
var macdbar = macd[2]
Here is also a ready-made teaching example; if you are interested, you can study it: https://www.fmz.com/strategy/151972