In the cryptocurrency asset trading space, obtaining and analyzing market data, querying rates, and monitoring account asset movements are all critical operations. Below are code examples of implementations for some common requirements.
1. How do I write the code about getting the currency with the highest increase in 4 hours on Binance Spot?
When writing a quantitative trading strategy program on FMZ platform, the first thing you need to do when you encounter a requirement is to analyze it. So based on the requirements, we analyzed the following contents:
- Which programming language to use?
The plan is to use Javascript to implement it. - Requires spot real-time quotes in all currencies
The first thing we did when we saw the requirement was to look up Binance API document to find out if there was any aggregated quotes (it’s best to have aggregated quotes, it’s a lot of work to look up one by one).
We found the aggregated quotes interface:GET https://api.binance.com/api/v3/ticker/price.
On FMZ platform, use theHttpQueryfunction to access the exchange ticker interface (public interface that does not require a signature). - Need to count data for a rolling window period of 4 hours
Conceptualize how to design the structure of the statistical program. - Calculate price fluctuations and sort them
Thinking about the price fluctuations algorithm, is it:price fluctuations (%) = (current price - initial price) / initial price * 100in “%”.
After figuring out the problem, as well as defining the program. We then got down to the business of designing the program.
Code Design
var dictSymbolsPrice = {}

functionmain() {
    while (true) {
        // GET https://api.binance.com/api/v3/ticker/pricetry {
            var arr = JSON.parse(HttpQuery("https://api.binance.com/api/v3/ticker/price"))
            if (!Array.isArray(arr)) {
                Sleep(5000)
                continue
            }

            var ts = newDate().getTime()
            for (var i = 0; i < arr.length; i++) {
                var symbolPriceInfo = arr[i]
                var symbol = symbolPriceInfo.symbolvar price = symbolPriceInfo.priceif (typeof(dictSymbolsPrice[symbol]) == "undefined") {
                    dictSymbolsPrice[symbol] = {name: symbol, data: []}
                }
                dictSymbolsPrice[symbol].data.push({ts: ts, price: price})
            }
        } catch(e) {
            Log("e.name:", e.name, "e.stack:", e.stack, "e.message:", e.message)
        }

        // Calculate price fluctuationsvar tbl = {
            type : "table",
            title : "Price fluctuations",
            cols : ["trading pair", "current price", "price 4 hours ago", "price fluctuations", "data length", "earliest data time", "latest data time"],
            rows : []
        }
        for (var symbol in dictSymbolsPrice) {
            var data = dictSymbolsPrice[symbol].dataif (data[data.length - 1].ts - data[0].ts > 1000 * 60 * 60 * 4) {
                dictSymbolsPrice[symbol].data.shift()
            }

            data = dictSymbolsPrice[symbol].data
            dictSymbolsPrice[symbol].percentageChange = (data[data.length - 1].price - data[0].price) / data[0].price * 100
        }

        var entries = Object.entries(dictSymbolsPrice)
        entries.sort((a, b) => b[1].percentageChange - a[1].percentageChange)

        for (var i = 0; i < entries.length; i++) {
            if (i > 9) {
                break
            }
            var name = entries[i][1].namevar data = entries[i][1].datavar percentageChange = entries[i][1].percentageChangevar currPrice = data[data.length - 1].pricevar currTs = _D(data[data.length - 1].ts)
            var prePrice = data[0].pricevar preTs = _D(data[0].ts)
            var dataLen = data.length

            tbl.rows.push([name, currPrice, prePrice, percentageChange + "%", dataLen, preTs, currTs])
        }

        LogStatus(_D(), "\n", "`" + JSON.stringify(tbl) + "`")
        Sleep(5000)
    }
}
Code Analysis
- Data structure
var dictSymbolsPrice = {}: An empty object to store price information for each trading pair. The key is the symbol of the trading pair, and the value is an object containing the name of the trading pair, an array of price data, and information about the price fluctuations.
while (true) {
    // ...
}
The program continuously monitors the Binance API trading pair prices through an infinite loop.
2.2. Get price information
var arr = JSON.parse(HttpQuery("https://api.binance.com/api/v3/ticker/price"))
Get the current price information of the trading pair via Binance API. If the return is not an array, wait for 5 seconds and retry.
2.3. Update price data
for (var i = 0; i < arr.length; i++) {
    // ...
}
Iterate through the array of obtained price information and update the data in dictSymbolsPrice. For each trading pair, add the current timestamp and price to the corresponding data array.
2.4. Exception processing
} catch(e) {
    Log("e.name:", e.name, "e.stack:", e.stack, "e.message:", e.message)
}
Catch exceptions and log the exception information to ensure that the program can continue to execute.
2.5. Calculate the price fluctuations
for (var symbol in dictSymbolsPrice) {
    // ...
}
Iterate through dictSymbolsPrice, calculate the price fluctuations of each trading pair, and remove the earliest data if it is longer than 4 hours.
2.6. Sort and generate tables
var entries = Object.entries(dictSymbolsPrice)
entries.sort((a, b) => b[1].percentageChange - a[1].percentageChange)

for (var i = 0; i < entries.length; i++) {
    // ...
}
Sort the trading pairs in descending order of their price fluctuations and generate a table containing information about the trading pairs.
2.7. Log output and delay
LogStatus(_D(), "\n", "`" + JSON.stringify(tbl) + "`")
Sleep(5000)
Output the table and the current time in the form of a log and wait for 5 seconds to continue the next round of the loop.
The program obtains the real-time price information of the trading pair through Binance API, then calculates the price fluctuations, and outputs it to the log in the form of a table. The program is executed in a continuous loop to realize the function of real-time monitoring of the prices of trading pairs. Note that the program includes exception processing to ensure that the execution is not interrupted by exceptions when obtaining price information.
Live Trading Running Test
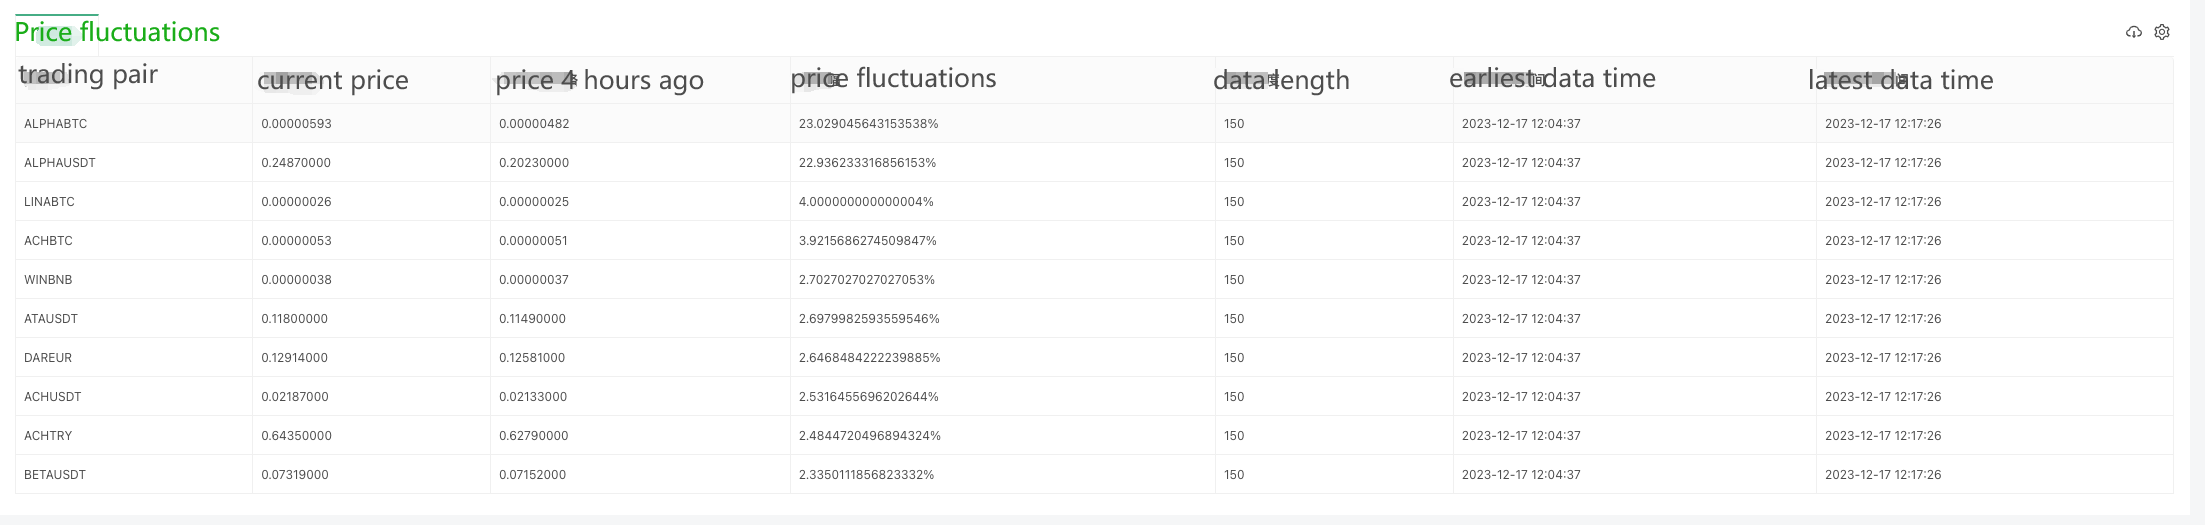
Since data can only be collected bit by bit at the beginning, it is not possible to calculate the price fluctuations on a rolling basis without collecting enough data for a 4-hour window. Therefore, the initial price is used as the base for calculation, and after collecting enough data for 4 hours, the oldest data will be eliminated in order to maintain the 4-hour window for calculating the price fluctuations.
2. Check the full variety of funding rates for Binance U-denominated contracts
Checking the funding rate is similar to the above code, first of all, we need to check the Binance API documentation to find the funding rate related interface. Binance has several interfaces that allow us to query the rate of funds, here we take the interface of the U-denominated contract as an example:
GEThttps://fapi.binance.com/fapi/v1/premiumIndex
Code Implementation
Since there are so many contracts, we’re exporting the top 10 largest funding rates here.
functionmain() {
while (true) {
// GET https://fapi.binance.com/fapi/v1/premiumIndextry {
var arr = JSON.parse(HttpQuery("https://fapi.binance.com/fapi/v1/premiumIndex"))
if (!Array.isArray(arr)) {
Sleep(5000)
continue
}
arr.sort((a, b) =>parseFloat(b.lastFundingRate) - parseFloat(a.lastFundingRate))
var tbl = {
type: "table",
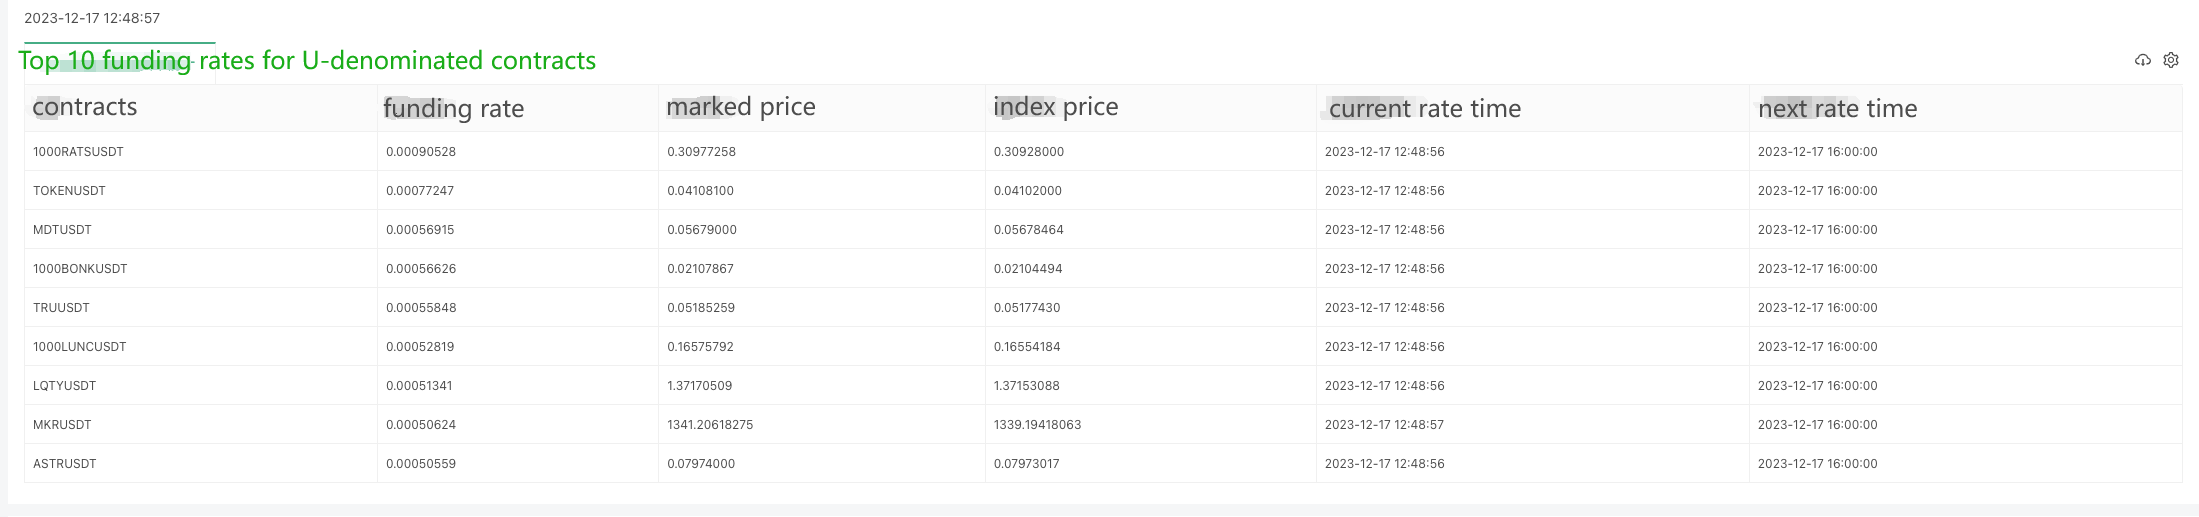
title: "Top 10 funding rates for U-denominated contracts",
cols: ["contracts", "funding rate", "marked price", "index price", "current rate time", "next rate time"],
rows: []
}
for (var i = 0; i < 9; i++) {
var obj = arr[i]
tbl.rows.push([obj.symbol, obj.lastFundingRate, obj.markPrice, obj.indexPrice, _D(obj.time), _D(obj.nextFundingTime)])
}
LogStatus(_D(), "\n", "`" + JSON.stringify(tbl) + "`")
} catch(e) {
Log("e.name:", e.name, "e.stack:", e.stack, "e.message:", e.message)
}
Sleep(1000 * 10)
}
}
The returned data structure is as follows, and check the Binance documentation, it shows that lastFundingRate is the funding rate we want.
{
    "symbol":"STMXUSDT",
    "markPrice":"0.00883606",
    "indexPrice":"0.00883074",
    "estimatedSettlePrice":"0.00876933",
    "lastFundingRate":"0.00026573",
    "interestRate":"0.00005000",
    "nextFundingTime":1702828800000,
    "time":1702816229000
}
Live trading running test:
Getting OKX exchange contract funding rates of Python version
A user has asked for a Python version of the example, and it’s for the OKX exchange. Here is an example:
The data returned by the interface https://www.okx.com/priapi/v5/public/funding-rate-all?currencyType=1:
{
    "code":"0",
    "data":[
        {
            "fundingTime":1702828800000,
            "fundingList":[
                {
                    "instId":"BTC-USDT-SWAP",
                    "nextFundingRate":"0.0001102188733642",
                    "minFundingRate":"-0.00375",
                    "fundingRate":"0.0000821861465884",
                    "maxFundingRate":"0.00375"
                } ...
Specific code:
import requests
import json
from time import sleep
from datetime import datetime
defmain():
whileTrue:
# https://www.okx.com/priapi/v5/public/funding-rate-all?currencyType=1try:
response = requests.get("https://www.okx.com/priapi/v5/public/funding-rate-all?currencyType=1")
arr = response.json()["data"][0]["fundingList"]
Log(arr)
ifnotisinstance(arr, list):
sleep(5)
continue
arr.sort(key=lambda x: float(x["fundingRate"]), reverse=True)
tbl = {
"type": "table",
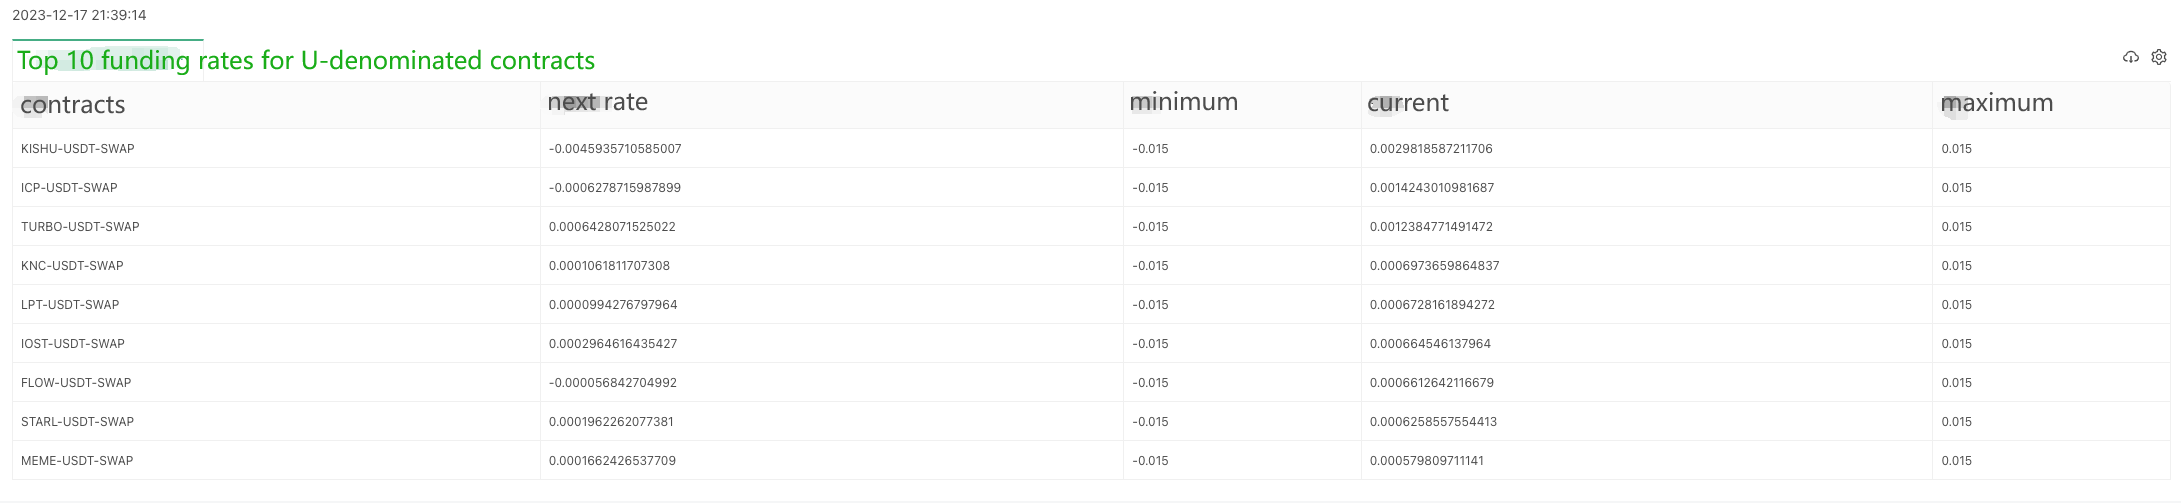
"title": "Top 10 funding rates for U-denominated contracts",
"cols": ["contracts", "next rate", "minimum", "current", "maximum"],
"rows": []
}
for i inrange(min(9, len(arr))):
obj = arr[i]
row = [
obj["instId"],
obj["nextFundingRate"],
obj["minFundingRate"],
obj["fundingRate"],
obj["maxFundingRate"]
]
tbl["rows"].append(row)
LogStatus(_D(), "\n", '`' + json.dumps(tbl) + '`')
except Exception as e:
Log(f"Error: {str(e)}")
sleep(10)
Live trading running test:
END
These examples provide basic design ideas and calling methods, the actual project may need to make appropriate changes and extensions based on the specific needs. Hopefully, these codes can help you better meet the various needs in cryptocurrency digital asset trading.