Preface
The backtesting system of the FMZ Quant Trading Platform is a backtesting system that is constantly iterating, updating and upgrading. It adds functions and optimizes performance gradually from the initial basic backtesting function. With the development of the platform, the backtesting system will continue to be optimized and upgraded. Today we will discuss a topic based on the backtesting system: “Strategy testing based on random tickers”.
Demand
In the field of quantitative trading, the development and optimization of strategies cannot be separated from the verification of real market data. However, in actual applications, due to the complex and changing market environment, relying on historical data for backtesting may be insufficient, such as lack of coverage of extreme market conditions or special scenarios. Therefore, designing an efficient random market generator has become an effective tool for quantitative strategy developers.
When we need to let the strategy trace back historical data on a certain exchange or currency, we can use the official data source of the FMZ platform for backtesting. Sometimes we also want to see how the strategy performs in a completely “unfamiliar” market, so we can “fabricate” some data to test the strategy.
The significance of using random ticker data is:
-
- Evaluate the robustness of strategies
The random ticker generator can create a variety of possible market scenarios, including extreme volatility, low volatility, trending markets, and volatile markets. Testing strategies in these simulated environments can help evaluate whether their performance is stable under different market conditions. For example:
- Evaluate the robustness of strategies
Can the strategy adapt to the trend and volatiity switching?
Will the strategy incur a large loss in extreme market conditions?
-
- Identify potential weaknesses in the strategy
By simulating some abnormal market situations (such as hypothetical black swan events), potential weaknesses in the strategy can be discovered and improved. For example:
- Identify potential weaknesses in the strategy
Does the strategy rely too much on a certain market structure?
Is there a risk of overfitting parameters?
- Optimizing strategy parameters
Randomly generated data provides a more diverse testing environment for strategy parameter optimization, without having to rely entirely on historical data. This allows you to find the strategy’s parameter range more comprehensively and avoid being limited to specific market patterns in historical data.
- Filling the gap in historical data
In some markets (such as emerging markets or small currency trading markets), historical data may not be sufficient to cover all possible market conditions. The random ticker generator can provide a large amount of supplementary data to help conduct more comprehensive testing.
- Rapid iterative development
Using random data for rapid testing can speed up the iteration of strategy development without relying on real-time market ticker conditions or time-consuming data cleaning and organization.
- Optimizing strategy parameters
However, it is also necessary to evaluate the strategy rationally. For randomly generated ticker data, please note:
- Although random market generators are useful, their significance depends on the quality of the generated data and the design of the target scenario:
- The generation logic needs to be close to the real market: If the randomly generated market is completely out of touch with reality, the test results may lack reference value. For example, the generator can be designed based on the actual market statistical characteristics (such as volatility distribution, trend ratio).
- It cannot completely replace real data testing: random data can only supplement the development and optimization of strategies. The final strategy still needs to be verified for its effectiveness in real market data.
Having said so much, how can we “fabricate” some data? How can we “fabricate” data for the backtesting system to use conveniently, quickly and easily?
Design Ideas
This article is designed to provide a starting point for discussion and provides a relatively simple random ticker generation calculation. In fact, there are a variety of simulation algorithms, data models and other technologies that can be applied. Due to the limited space of the discussion, we will not use complex data simulation methods.
Combining the custom data source function of the platform backtesting system, we wrote a program in Python.
- Generate a set of K-line data randomly and write them into a CSV file for persistent recording, so that the generated data can be saved.
- Then create a service to provide data source support for the backtesting system.
- Display the generated K-line data in the chart.
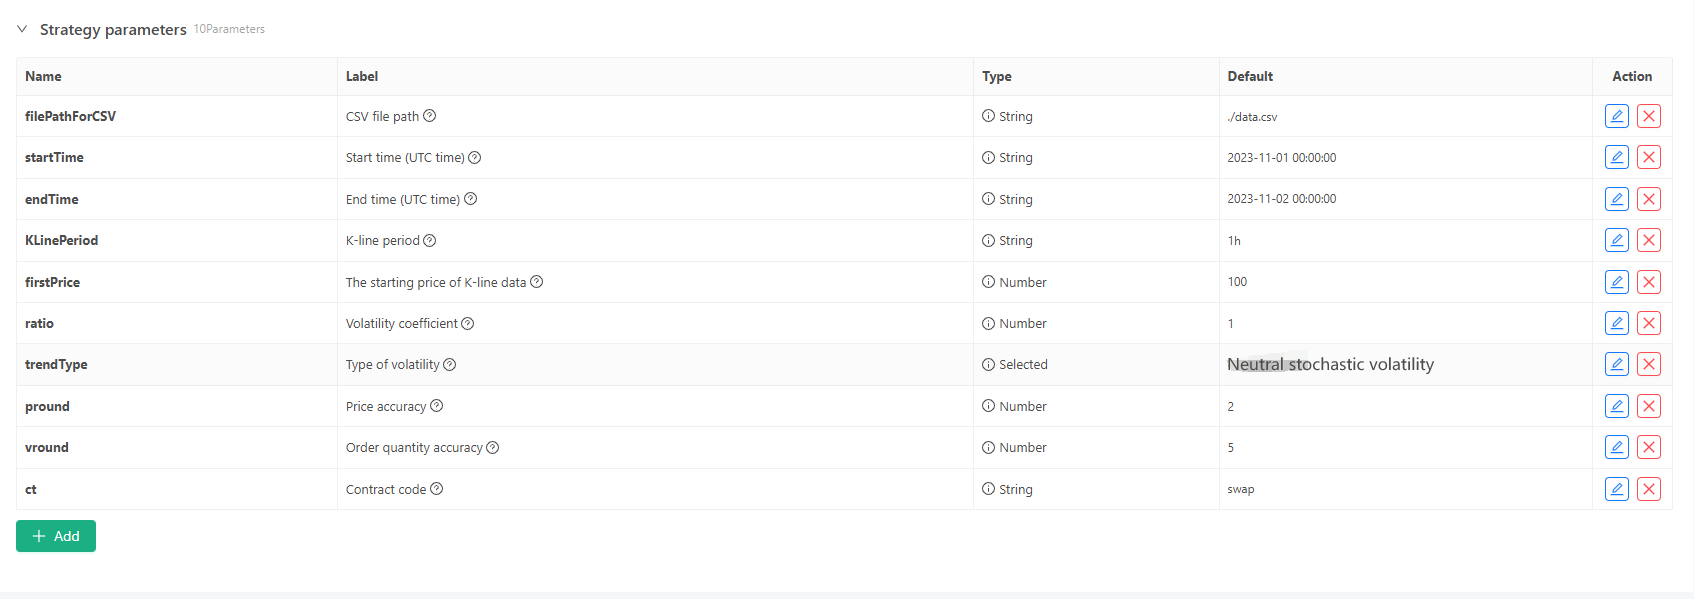
For some generation standards and file storage of K-line data, the following parameter controls can be defined:

- Random data generation mode
For the simulation of the fluctuation type of K-line data, a simple design is simply made using the probability of positive and negative random numbers. When the generated data is not much, it may not reflect the required market pattern. If there is a better method, this part of the code can be replaced.
Based on this simple design, adjusting the random number generation range and some coefficients in the code can affect the generated data effect. - Data verification
The generated K-line data also needs to be tested for rationality, to check whether the high opening and low closing prices violate the definition, and to check the continuity of the K-line data.
Backtesting System Random Ticker Generator
import _thread
import json
import math
import csv
import random
import os
import datetime as dt
from http.server import HTTPServer, BaseHTTPRequestHandler
from urllib.parse import parse_qs, urlparse

arrTrendType = ["down", "slow_up", "sharp_down", "sharp_up", "narrow_range", "wide_range", "neutral_random"]

defurl2Dict(url):
    query = urlparse(url).query
    params = parse_qs(query)
    result = {key: params[key][0] for key in params}
    return result

classProvider(BaseHTTPRequestHandler):
    defdo_GET(self):
        global filePathForCSV, pround, vround, ct
        try:
            self.send_response(200)
            self.send_header("Content-type", "application/json")
            self.end_headers()

            dictParam = url2Dict(self.path)
            Log("the custom data source service receives the request, self.path:", self.path, "query parameter:", dictParam)

            eid = dictParam["eid"]
            symbol = dictParam["symbol"]
            arrCurrency = symbol.split(".")[0].split("_")
            baseCurrency = arrCurrency[0]
            quoteCurrency = arrCurrency[1]
            fromTS = int(dictParam["from"]) * int(1000)
            toTS = int(dictParam["to"]) * int(1000)
            priceRatio = math.pow(10, int(pround))
            amountRatio = math.pow(10, int(vround))

            data = {
                "detail": {
                    "eid": eid,
                    "symbol": symbol,
                    "alias": symbol,
                    "baseCurrency": baseCurrency,
                    "quoteCurrency": quoteCurrency,
                    "marginCurrency": quoteCurrency,
                    "basePrecision": vround,
                    "quotePrecision": pround,
                    "minQty": 0.00001,
                    "maxQty": 9000,
                    "minNotional": 5,
                    "maxNotional": 9000000,
                    "priceTick": 10 ** -pround,
                    "volumeTick": 10 ** -vround,
                    "marginLevel": 10,
                    "contractType": ct
                },
                "schema" : ["time", "open", "high", "low", "close", "vol"],
                "data" : []
            }

            listDataSequence = []
            withopen(filePathForCSV, "r") as f:
                reader = csv.reader(f)
                header = next(reader)
                headerIsNoneCount = 0iflen(header) != len(data["schema"]):
                    Log("The CSV file format is incorrect, the number of columns is different, please check!", "#FF0000")
                    returnfor ele in header:
                    for i inrange(len(data["schema"])):
                        if data["schema"][i] == ele or ele == "":
                            if ele == "":
                                headerIsNoneCount += 1if headerIsNoneCount > 1:
                                Log("The CSV file format is incorrect, please check!", "#FF0000")
                                return
                            listDataSequence.append(i)
                            breakwhileTrue:
                    record = next(reader, -1)
                    if record == -1:
                        break
                    index = 0
                    arr = [0, 0, 0, 0, 0, 0]
                    for ele in record:
                        arr[listDataSequence[index]] = int(ele) if listDataSequence[index] == 0else (int(float(ele) * amountRatio) if listDataSequence[index] == 5elseint(float(ele) * priceRatio))
                        index += 1
                    data["data"].append(arr)
            Log("data.detail: ", data["detail"], "Respond to backtesting system requests.")
            self.wfile.write(json.dumps(data).encode())
        except BaseException as e:
            Log("Provider do_GET error, e:", e)
        returndefcreateServer(host):
    try:
        server = HTTPServer(host, Provider)
        Log("Starting server, listen at: %s:%s" % host)
        server.serve_forever()
    except BaseException as e:
        Log("createServer error, e:", e)
        raise Exception("stop")

classKlineGenerator:
    def__init__(self, start_time, end_time, interval):
        self.start_time = dt.datetime.strptime(start_time, "%Y-%m-%d %H:%M:%S")
        self.end_time = dt.datetime.strptime(end_time, "%Y-%m-%d %H:%M:%S")
        self.interval = self._parse_interval(interval)
        self.timestamps = self._generate_time_series()

    def_parse_interval(self, interval):
        unit = interval[-1]
        value = int(interval[:-1])

        if unit == "m":
            return value * 60elif unit == "h":
            return value * 3600elif unit == "d":
            return value * 86400else:
            raise ValueError("Unsupported K-line period, please use 'm', 'h', or 'd'.")

    def_generate_time_series(self):
        timestamps = []
        current_time = self.start_time
        while current_time <= self.end_time:
            timestamps.append(int(current_time.timestamp() * 1000))
            current_time += dt.timedelta(seconds=self.interval)
        return timestamps

    defgenerate(self, initPrice, trend_type="neutral", volatility=1):
        data = []
        current_price = initPrice
        angle = 0for timestamp inself.timestamps:
            angle_radians = math.radians(angle % 360)
            cos_value = math.cos(angle_radians)

            if trend_type == "down":
                upFactor = random.uniform(0, 0.5)
                change = random.uniform(-0.5, 0.5 * upFactor) * volatility * random.uniform(1, 3)
            elif trend_type == "slow_up":
                downFactor = random.uniform(0, 0.5)
                change = random.uniform(-0.5 * downFactor, 0.5) * volatility * random.uniform(1, 3)
            elif trend_type == "sharp_down":
                upFactor = random.uniform(0, 0.5)
                change = random.uniform(-10, 0.5 * upFactor) * volatility * random.uniform(1, 3)
            elif trend_type == "sharp_up":
                downFactor = random.uniform(0, 0.5)
                change = random.uniform(-0.5 * downFactor, 10) * volatility * random.uniform(1, 3)
            elif trend_type == "narrow_range":
                change = random.uniform(-0.2, 0.2) * volatility * random.uniform(1, 3)
            elif trend_type == "wide_range":
                change = random.uniform(-3, 3) * volatility * random.uniform(1, 3)
            else:
                change = random.uniform(-0.5, 0.5) * volatility * random.uniform(1, 3)

            change = change + cos_value * random.uniform(-0.2, 0.2) * volatility
            open_price = current_price
            high_price = open_price + random.uniform(0, abs(change))
            low_price = max(open_price - random.uniform(0, abs(change)), random.uniform(0, open_price))
            close_price = open_price + change if open_price + change < high_price and open_price + change > low_price else random.uniform(low_price, high_price)

            if (high_price >= open_price and open_price >= close_price and close_price >= low_price) or (high_price >= close_price and close_price >= open_price and open_price >= low_price):
                passelse:
                Log("Abnormal data:", high_price, open_price, low_price, close_price, "#FF0000")

            high_price = max(high_price, open_price, close_price)
            low_price = min(low_price, open_price, close_price)

            base_volume = random.uniform(1000, 5000)
            volume = base_volume * (1 + abs(change) * 0.2)

            kline = {
                "Time": timestamp,
                "Open": round(open_price, 2),
                "High": round(high_price, 2),
                "Low": round(low_price, 2),
                "Close": round(close_price, 2),
                "Volume": round(volume, 2),
            }
            data.append(kline)
            current_price = close_price
            angle += 1return data

    defsave_to_csv(self, filename, data):
        withopen(filename, mode="w", newline="") as csvfile:
            writer = csv.writer(csvfile)
            writer.writerow(["", "open", "high", "low", "close", "vol"])
            for idx, kline inenumerate(data):
                writer.writerow(
                    [kline["Time"], kline["Open"], kline["High"], kline["Low"], kline["Close"], kline["Volume"]]
                )

        Log("Current path:", os.getcwd())
        withopen("data.csv", "r") as file:
            lines = file.readlines()
            iflen(lines) > 1:
                Log("The file was written successfully. The following is part of the file content:")
                Log("".join(lines[:5]))
            else:
                Log("Failed to write the file, the file is empty!")

defmain():
    Chart({})
    LogReset(1)

    try:
        # _thread.start_new_thread(createServer, (("localhost", 9090), ))
        _thread.start_new_thread(createServer, (("0.0.0.0", 9090), ))
        Log("Start the custom data source service thread, and the data is provided by the CSV file.", ", Address/Port: 0.0.0.0:9090", "#FF0000")
    except BaseException as e:
        Log("Failed to start custom data source service!")
        Log("error message:", e)
        raise Exception("stop")

    whileTrue:
        cmd = GetCommand()
        if cmd:
            if cmd == "createRecords":
                Log("Generator parameters:", "Start time:", startTime, "End time:", endTime, "K-line period:", KLinePeriod, "Initial price:", firstPrice, "Type of volatility:", arrTrendType[trendType], "Volatility coefficient:", ratio)
                generator = KlineGenerator(
                    start_time=startTime,
                    end_time=endTime,
                    interval=KLinePeriod,
                )
                kline_data = generator.generate(firstPrice, trend_type=arrTrendType[trendType], volatility=ratio)
                generator.save_to_csv("data.csv", kline_data)
                ext.PlotRecords(kline_data, "%s_%s" % ("records", KLinePeriod))
        LogStatus(_D())
        Sleep(2000)
Practice in Backtesting System
- Create the above strategy instance, configure parameters, and run it.
- The live trading (strategy instance) needs to be run on the docker deployed on the server, it needs a public network IP, so that the backtesting system can access it and obtain data.
- Click the interaction button, and the strategy will start generating random ticker data automatically.

- The generated data will be displayed on the chart for easy observation, and the data will be recorded in the local data.csv file.

- Now we can use this randomly generated data and use any strategy for backtesting:

/*backtest
start: 2024-10-01 08:00:00
end: 2024-10-31 08:55:00
period: 1h
basePeriod: 1h
exchanges: [{"eid":"Futures_Binance","currency":"BTC_USDT","feeder":"http://xxx.xxx.xxx.xxx:9090"}]
args: [["ContractType","quarter",358374]]
*/
According to the above information, configure and adjust. http://xxx.xxx.xxx.xxx:9090 is the server IP address and open port of the random ticker generation strategy.
This is the custom data source, which can be found in the Custom Data Source section of the platform API document.
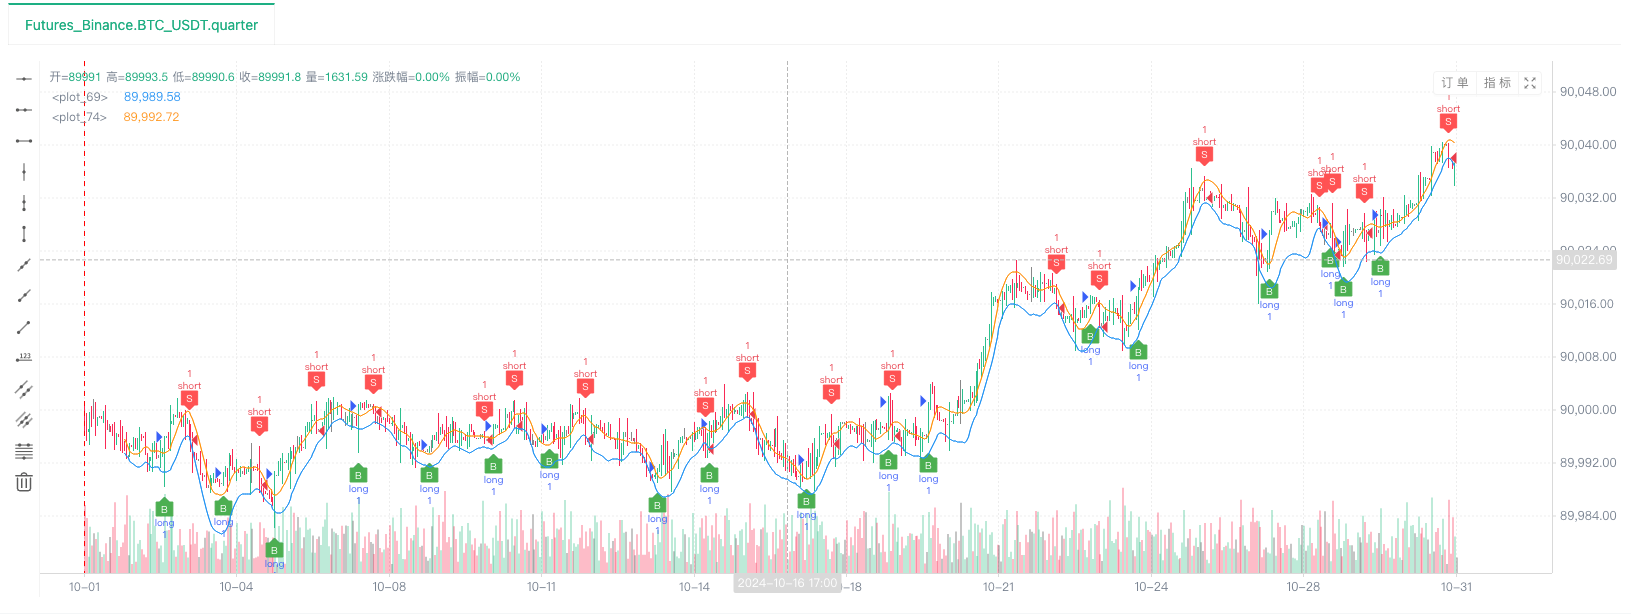
- After the backtest system sets up the data source, we can test the random market data:


At this time, the backtest system is tested with our “fabricated” simulated data. According to the data in the ticker chart during the backtest, the data in the live trading chart generated by the random market is compared. The time is: 17:00 on October 16, 2024, and the data is the same.
- Oh, yes, I almost forgot to mention it! The reason why this Python program of random ticker generator creates a live trading is to facilitate demonstration, operation, and display of generated K-line data. In actual application, you can write an independent Python script, so you don’t have to run the live trading.
Strategy source code: Backtesting System Random Ticker Generator
Thank you for your support and reading.
From: Discussion on Strategy Testing Method Based on Random Ticker Generator


