In quantitative trading, the traditional K-line chart is one of the most commonly used data presentation forms, but it also has certain limitations, such as insensitivity to fluctuations or excessive noise. In order to observe price trends more clearly, traders often use some improved charts, such as:
- Renko: based on price changes rather than time, it filtering market noise effectively.
- Heikin Ashi: by smoothing price data, it can show the trend direction more intuitively.
This article will introduce how to calculate the Renko and Heikin Ashi data based on ordinary K-lines on the FMZ Quant Trading Platform, and show the drawing effect, to help strategy developers analyze market trends more intuitively.
Renko
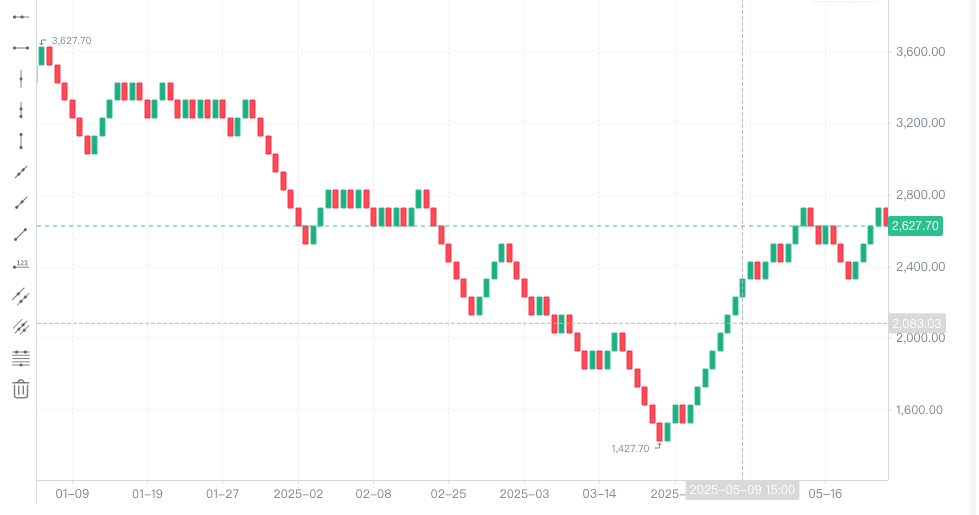
The Renko is based on “bricks”, and a new brick is drawn only when the price fluctuation exceeds a fixed range (such as $100).
- Advantages: Based on price changes, it filters out small fluctuations in the market and highlights the main trend.
- Applications: Suitable for identifying medium- and long-term trends and reducing noise interference in transactions.
Trading signal interpretation
- Trend confirmation: Continuous rising bricks indicate a strong trend and can be held; the appearance of reverse bricks is a trend reversal signal.
- Breakout trading: When a new brick appears, especially when it breaks the previous high/low, we can consider entering the market.
- False breakout filtering: Since the brick chart ignores small fluctuations, it helps to filter out small false breakouts during the oscillation period.
Core calculation logic:
- Set brickSize
- Based on the initial price, constantly compare whether the latest price deviates from the previous brick price by more than brickSize
- If the increase exceeds, draw an upward brick; the same applies to the decrease
Calculate the Renko, plot and implementation code:
/*backtest
start: 2025-05-01 00:00:00
end: 2025-06-06 00:00:00
period: 1h
basePeriod: 1m
exchanges: [{"eid":"Binance","currency":"ETH_USDT","balance":1000,"stocks":0.5}]
*/let globalbricks = []
let lastBarTime = 0functiongetBricks(r, brickSize, sourceAttribute, lastPrice) {
    for (let i = 1; i < r.length; i++) {
        let bar = r[i]
        let price = bar[sourceAttribute]
        let time = bar.Timeif (time < lastBarTime) {
            continue
        }
        // Traversing the original K-line datawhile (Math.abs(price - lastPrice) >= brickSize) {
            if (globalbricks.length > 0 && time == globalbricks[globalbricks.length - 1].Time) {
                time = globalbricks[globalbricks.length - 1].Time + 1000
            }
            // Construction brickslet brick = {
                Time: time,
                Open: lastPrice,
                Close: 0,
                High: 0,
                Low: 0
            }
            if (price > lastPrice) {
                // Rising bricks
                lastPrice += brickSize
                brick.Close = lastPrice
                brick.High = lastPrice
                brick.Low = brick.Open
            } else {
                // Falling bricks
                lastPrice -= brickSize
                brick.Close = lastPrice
                brick.High = brick.Open
                brick.Low = lastPrice
            }
            // Put into array
            globalbricks.push(brick)
            // time is accumulated by 1 second to prevent a BAR from being disconnected when it is divided into multiple bricks
            time += 1000
        }
        lastBarTime = bar.Time
    }
    return globalbricks
}
functiongetRenko(r, brickSize, sourceAttribute) {
    // If the original K-line data does not meet the calculation requirements, it will be returned directly.if (!r || r.length <= 0) {
        returnnull
    }
    if (globalbricks.length == 0) {
        returngetBricks(r, brickSize, sourceAttribute, r[0][sourceAttribute])
    } else {
        returngetBricks(r, brickSize, sourceAttribute, globalbricks[globalbricks.length - 1].Close)
    }
}
functionmain() {
    let c = KLineChart({
        overlay: true
    })
    while (true) {
        let r = _C(exchange.GetRecords)
        let bricks = getRenko(r, 100, "Close")
        bricks.forEach(function (brick, index) {
            c.begin(brick)
            c.close()
        })
        Sleep(1000)
    }
}
Backtesting
Heikin Ashi
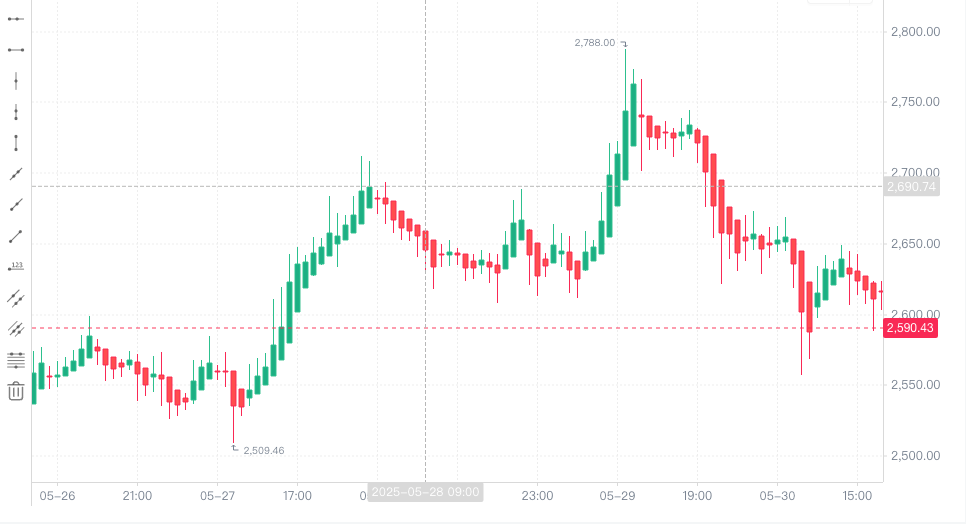
Heikin Ashi is a smoothing of traditional K-line
- Advantages: By smoothing price data, it provides a clearer trend direction and reduces false signals.
- Applications: Suitable for trend tracking strategies, helping traders hold positions longer in trends.
The calculation method is as follows:
HA_Close = (Open + High + Low + Close) / 4
HA_Open = (Previous HA_Open + Previous HA_Close) / 2
HA_High = max(High, HA_Open, HA_Close)
HA_Low = min(Low, HA_Open, HA_Close)
Heikin Ashi is essentially a moving average filtered K-line with stronger trend persistence.
Trend judgment and signal recognition
- A positive line with a large body and almost no upper and lower shadows indicates a strong upward trend
- A negative line with a large body and almost no upper and lower shadows indicates a strong downward trend
- The upper and lower shadows become longer, and the body shrinks. The trend weakens, so beware of reversals
- The body is very short, and the shadows are long. The market is volatile, so do not operate for the time being
Implementation code and plot:
/*backtest
start: 2025-05-01 00:00:00
end: 2025-06-06 00:00:00
period: 1h
basePeriod: 1h
exchanges: [{"eid":"Binance","currency":"ETH_USDT","balance":1000,"stocks":0.5}]
*/functiontoHeikinAshi(records) {
    if (!records || records.length == 0) {
        returnnull
    }
    let haRecords = []
    for (let i = 0; i < records.length; i++) {
        let r = records[i]
        let ha = {}
        ha.Time = r.Time
        ha.Close = (r.Open + r.High + r.Low + r.Close) / 4if (i === 0) {
            // The opening price of the first Heikin Ashi is the average of the opening and closing prices of the ordinary K-line.
            ha.Open = (r.Open + r.Close) / 2
        } else {
            // The opening price of each subsequent candlestick = the average of the previous Heikin Ashi opening and closing prices
            ha.Open = (haRecords[i - 1].Open + haRecords[i - 1].Close) / 2
        }
        ha.High = Math.max(r.High, ha.Open, ha.Close)
        ha.Low = Math.min(r.Low, ha.Open, ha.Close)
        haRecords.push(ha)
    }
    return haRecords
}
functionmain() {
    let c = KLineChart({
        overlay: true
    })
    while (true) {
        let r = _C(exchange.GetRecords)
        let heikinAshiRecords = toHeikinAshi(r)
        heikinAshiRecords.forEach(function (bar, index) {
            c.begin(bar)
            c.close()
        })
        Sleep(1000)
    }
}
Backtesting
END
The Renko and Heikin Ashi are powerful tools for trend traders:
- The Renko focuses on price displacement and is suitable for breakthroughs and trend confirmation.
- Heikin Ashi focuses on price smoothing and is suitable for trend position control.
- The two complement each other to improve the stability and anti-shock ability of trend strategy signals.
It is recommended to combine backtesting and live trading verification, choose a chart solution suitable for your own trading products and periods, and create a personalized quantitative trading system.
From: Visual Enhancement Tool! Use Renko and Heikin Ashi to Understand Market Trends on FMZ