Data Cycle: 15M, 30M, etc.
Support: Commodity Futures
Indicators are EMA, KD lines, and KD line use default parameters (index parameters fixed 3, 3, 9)
- Main chart:
EMA mean, formula: MAC ^^ EMA (C, N); - Secondary chart:
K line in KD, formula: K: SMA (RSV, M1, 1); //RSV moving average
D line in KD, formula: D: SMA (K, M2, 1); //K moving average value

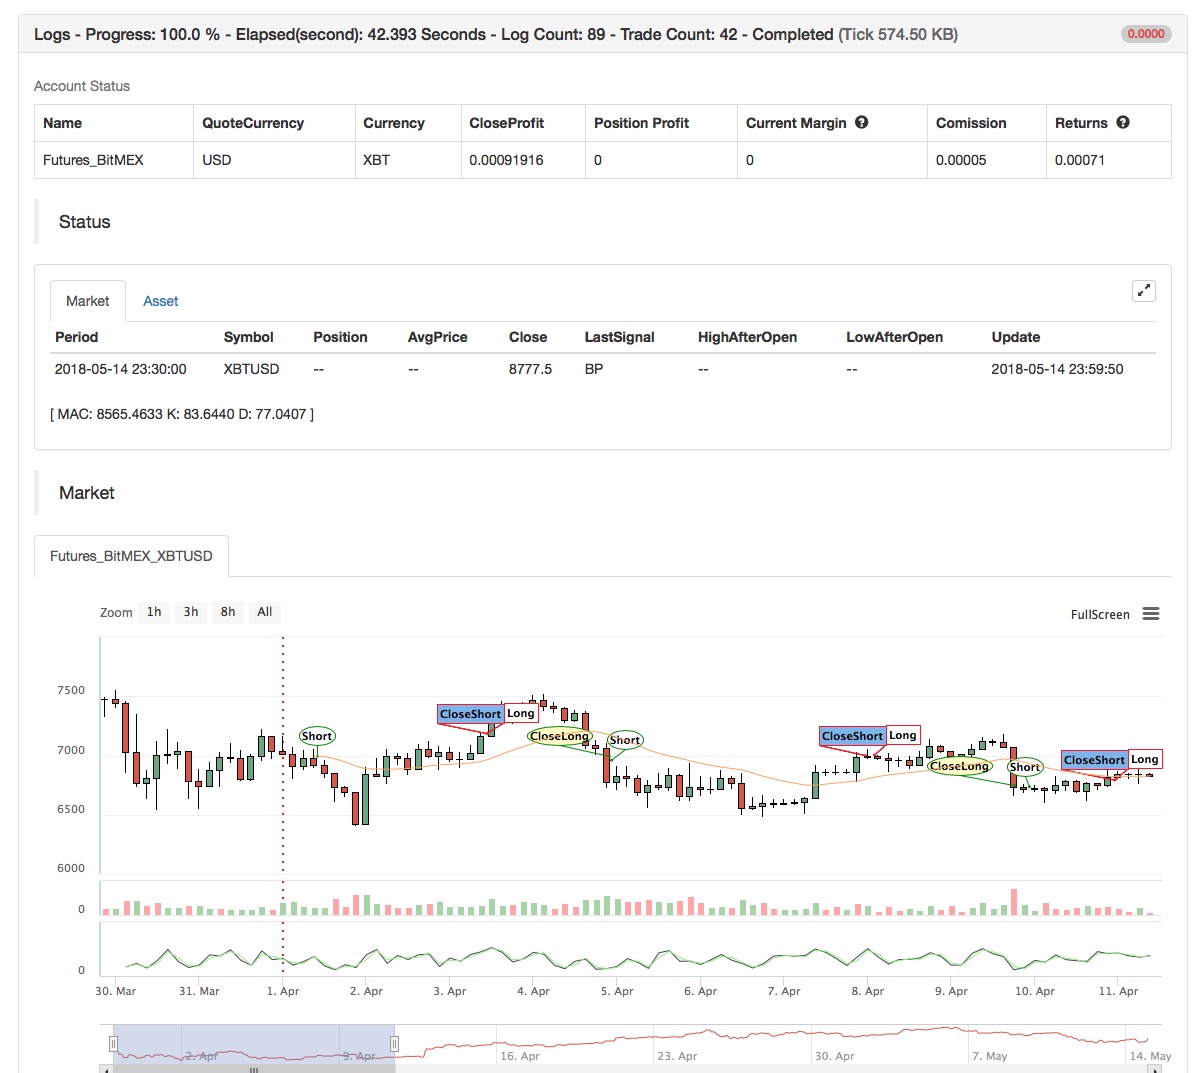
(*backtest
start: 2018-04-01 00:00:00
end: 2018-05-15 00:00:00
period: 30m
exchanges: [{"eid":"Futures_BitMEX","currency":"XBT_USD"}]
args: [["TradeAmount",100,126961],["ContractType","XBTUSD",126961]]
*)
MAC^^EMA(C,N);
NKD:=9;
M1:=3;
M2:=3;
RSV:=(CLOSE-LLV(LOW,NKD))/(HHV(HIGH,NKD)-LLV(LOW,NKD))*100;
//(1)closing price minus the lowest value in NKD cycle,
(2)the highest value in NKD cycle minus the lowest value in NKD cycle,
then (1) divided by (2).
K:SMA(RSV,M1,1);//MA of RSV
D:SMA(K,M2,1);//MA of K
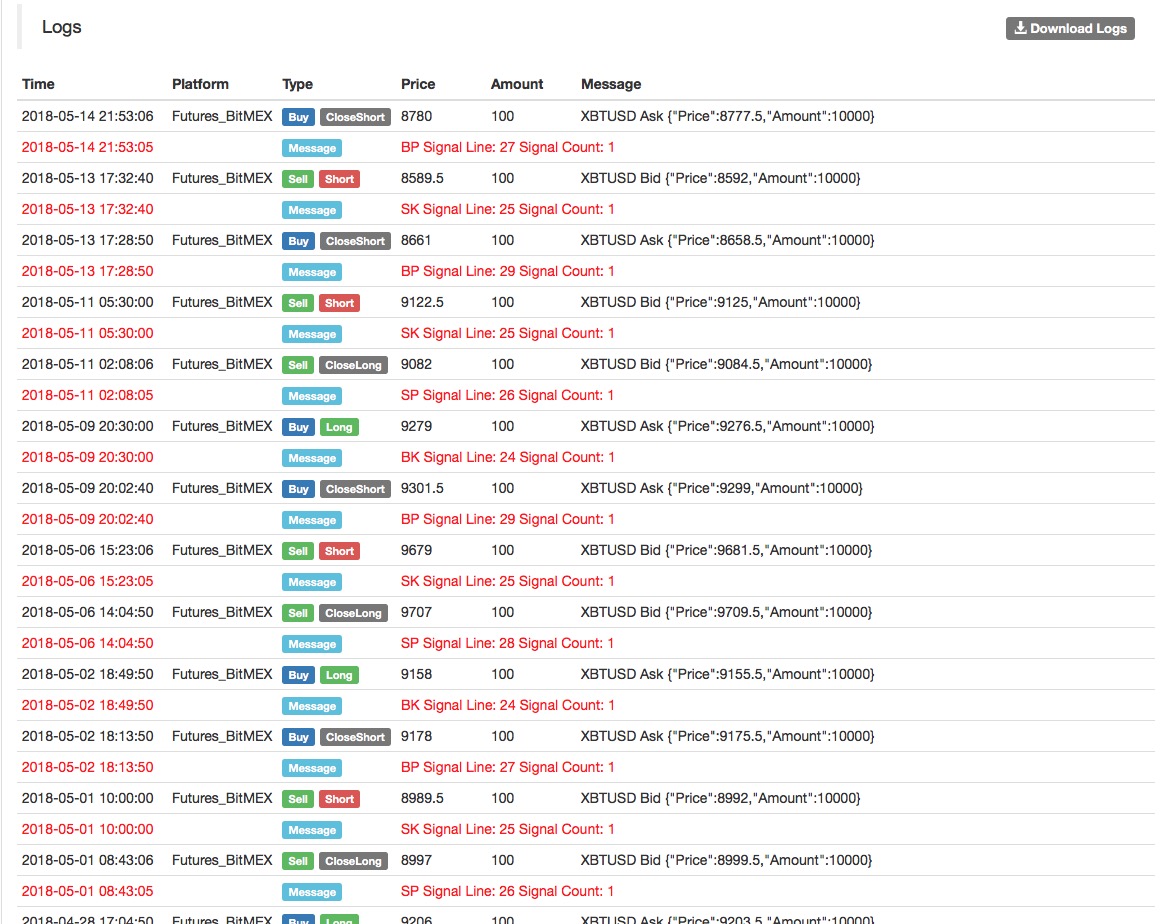
BARPOS>N AND C>MAC AND K<D,BK;
BARPOS>N AND C<MAC AND K>D,SK;
C<=BKPRICE*(1-SLOSS*0.01),SP(BKVOL);
C>=SKPRICE*(1+SLOSS*0.01),BP(SKVOL);
C>=BKPRICE*(1+SLOSS*0.01) AND C<MAC,SP(BKVOL);
C<=SKPRICE*(1-SLOSS*0.01) AND C>MAC,BP(SKVOL);
Backtest on FMZ Quant to know more
Source Code: https://www.fmz.com/strategy/128249