The origin of the box theory
The first contact box theory was seen in the book <<How I Made $2,000,000 in the Stock Market>> by Nicholas Davas, who was a dancer, uses the money earned after each global tour. Investing in stocks and earning $2 million in just a few years, the method he uses is the box theory.
This was an incredible thing at the time, so that Time magazine also reported on him. Later, he wrote his own trading history and trading methods into several books. Box theory is also mentioned in <<You Can Still Make It In The Market>>.
What is the box theory?
The so-called box can also be called a form, and its theoretical foundation draws on the support line and the resistance line. Normally, when the price rises to the previous high, it will encounter selling pressure to make the price fall. When the price falls to the previous low, it will encounter buying pressure and increase the price. If the price moves back and forth up and down as many times as this, it can form a box theory based on the high and low points of the historical price for a period of time.
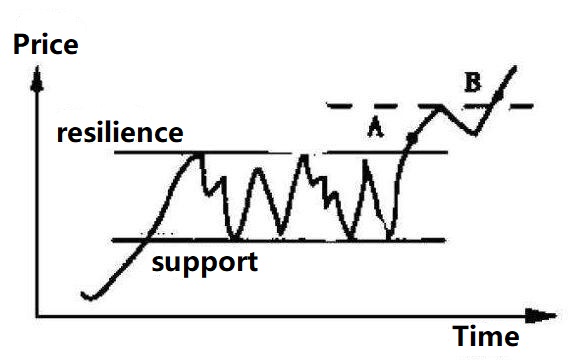
The concept of the box is a subjective definition of man-made. In theory, the box has the function of up and down resistance and support, and the price will always move up and down inside the box. Once the price breaks above the upper rail of the box, it means that this is a stronger bullish force than the resistance line. The future price may form a bullish trend and rise to another box of expectations. Conversely, once the price breaks down the lower rail of the box, it means that it is a stronger short-selling force than the support line. The future price may form a short trend and fall to another box expected.
The essence of the box theory
The idea of the box theory is to measure the possible price in the future through the price box. When the price breaks through the top of the box, it indicates that the price will reach a higher box. Conversely, when the price falls below the bottom of the box, it indicates that the price will reach a lower box.
Therefore, when the price effectively breaks through the top of the box, the previous resistance line will become the support line, and the price will enter the rising period in the future, or enter the higher box. Similarly, when the price effectively breaks down the bottom of the box, the previous support line will become the resistance line, and the price will enter the decline period in the future, or enter the lower box.
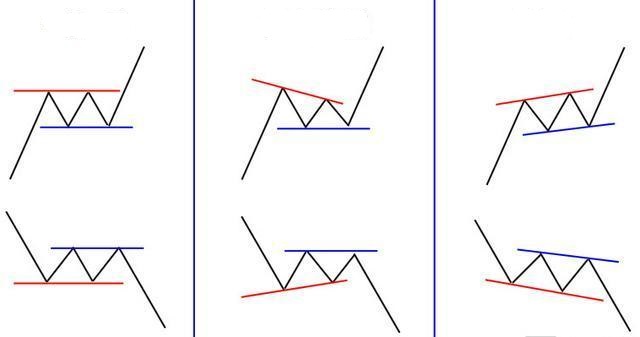
Futhermore, the shape of the box is not square in the market like a box. We know that the price trend is not always been a good shape. As shown above, sometimes the box will show a standard W shape or M shape, but sometimes it will also appear in the form of high before low or low before low, and even the flag shape.
Formula and strategy logic of box theory
Support price = the lowest closing price of the N period
Resistance price = the highest closing price of the N cycle
Box height = resistance price – support price
Using My language to write a box theory strategy on FMZ.COM
N=50;
PRICE:=(OPEN+HIGH+LOW+CLOSE*2)/5;
UPPERBAND: REF(HHV(PRICE,N),1);
LOWERBAND: REF(LLV(PRICE,N),1);
C>=UPPERBAND, BPK;
C<=LOWERBAND, SPK;
WWW.FMZ.COM: C, NODRAW;
MID=(UPPERBAND+LOWERBAND)/2;
C<MID||C<LLV(PRICE, N/2), SP;
C>MID||C>HHV(PRICE,N/2),BP;
AUTOFILTER;
The above is a trading strategy based on the box theory, supporting commodity futures and cryptocurrencies. When calculating the top and bottom of the box, there is no highest price and lowest price, but the average value of the opening price + the highest price + the lowest price + 2 times the closing price. The advantage of this is that you can filter some extreme price movements.
RangeBreak(Box theory) strategy backtest
In order to get closer to the real trading environment, we used the 2 pips slippage and 2 times of the transaction fee to test the pressure during the backtest. The test environment is as follows:
Trading variety: BTC to USDT
Time: October 23, 2013 ~ July 18, 2019
Cycle: Hourly K-line
Slippage: 2 pips for opening and closing positions
Transaction Fee: 2 times of the exchange
- Fund curve
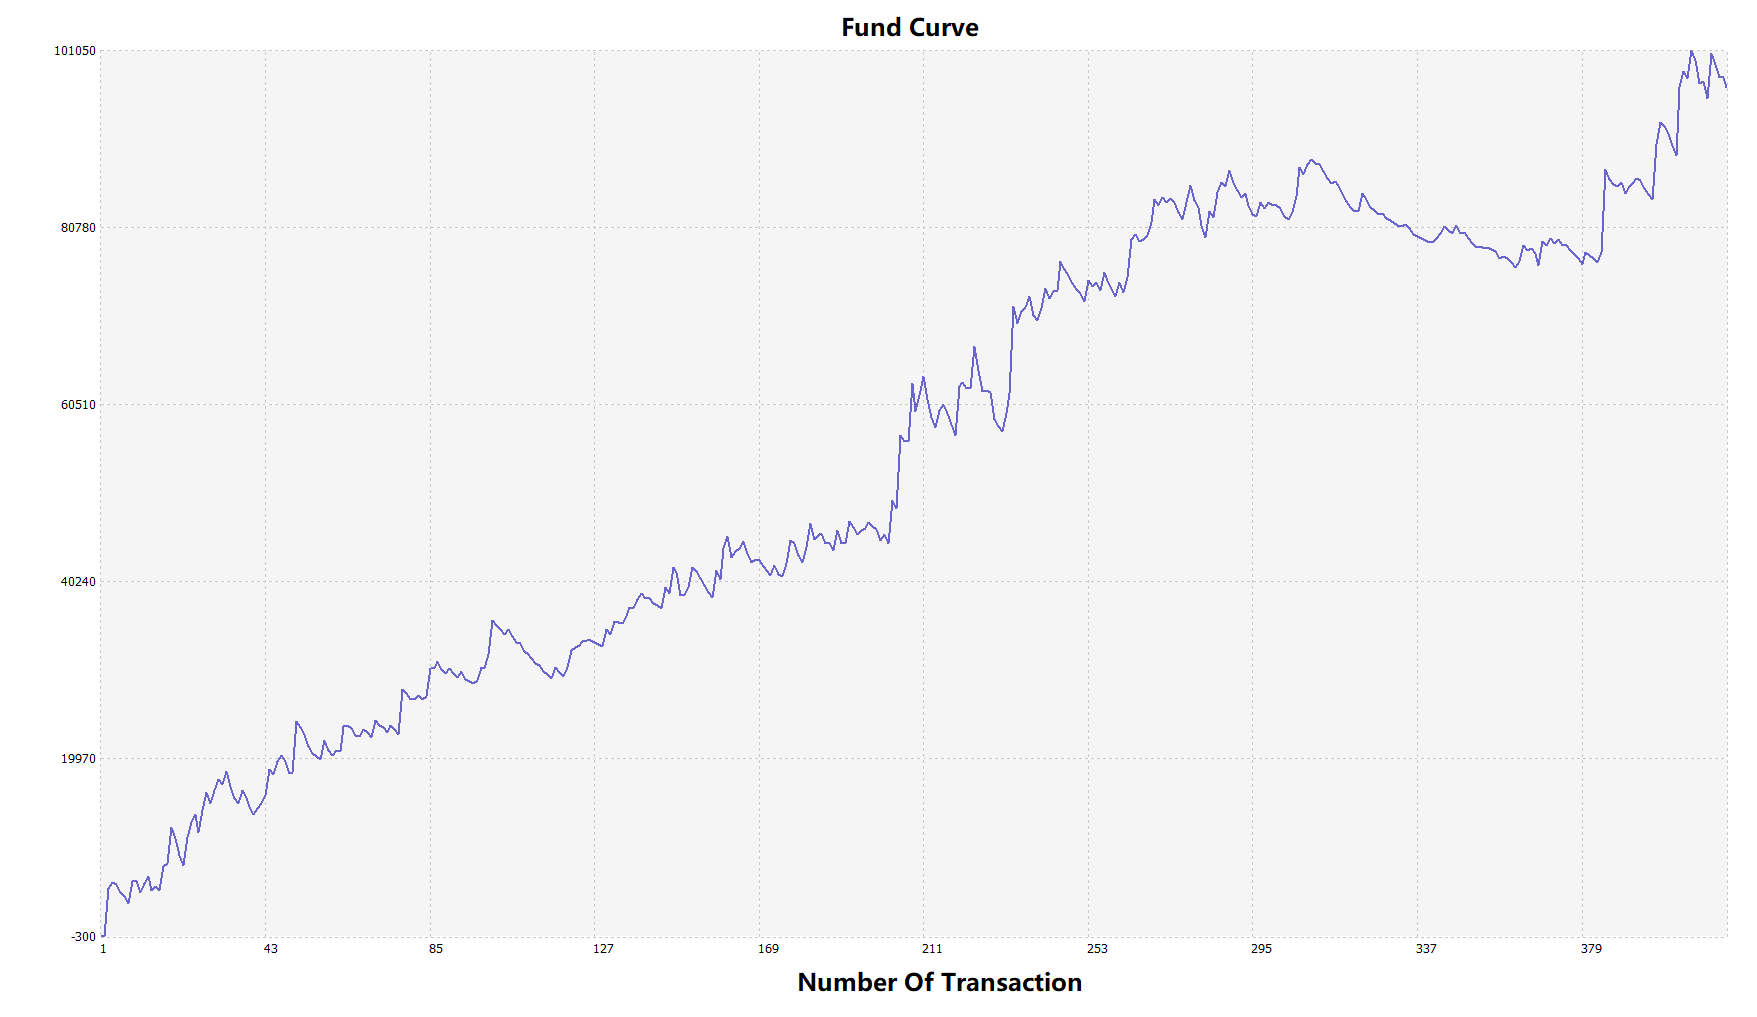
Overall, the report of backtest indicating the capital curve is steadily rising. Whether in the rising market or in the falling market, the strategy performs well when the market trend is smooth. Basically, every big trend can make a profit. And in the turbulent period of the market, it can also better control the withdrawal of the capital curve.
Copy strategy source code
For more information, please see: https://www.fmz.com/strategy/158088
Summary
As an ancient trading method, the box theory still maintains vitality in today’s cryptocurrency trading. Although the strategy in this article is relatively simple, it’s equally applicable in the field of crypto traders. A correct strategy framework does not care about the gains and losses of each transaction, but from a global perspective, as long as this strategy is in line with a small win, then long-term persistence will achieve stable profits.