Summary
The essence of trading strategy is to summarize the market principles and rules. The deeper your understanding of the market, the higher the ability to express ideas with code, the closer your strategy is to the market. This section will continue to explain how to optimize your trading strategy and make final preparations for your real market trading.
Optimize entry and exit
Most trend tracking strategies use breakouts or technical indicators to capture the market. Usually, the entry and exit of these signals is less time-efficient. If the strategy uses the closing price model, the entry point will be on the next K-line opening price. It will miss the best entry time for breaking through the current K-line, it also will miss a lot of profit.
So the effective way is to use a more advantageous real-time price in the strategy implementation, and when the signal appears, immediately place the order. This way, when the signal is established, you can open position immediately and you will not miss the profit. But not all real-time prices are better than the closing price, it should be determined by the trading strategy. Some trading logic is simple, the difference between real-time price and closing price effect is small. But if the closing price model can’t handle more detailed trading logic, you need to use real-time prices.
Parameter optimization
The strategy itself is a multidimensional instance. Each parameter is a dimension of this instance. All the parameter combinations construct the shape of this instance. When the shape of the instance is highly aligned with the shape of the market, the maximum profit is generated. Finally, the final rate of return for the selection domain of all parameters constitutes a complex multidimensional surface. When the strategy has only two parameters, they form an intuitive three-dimensional surface with the final rate of return.
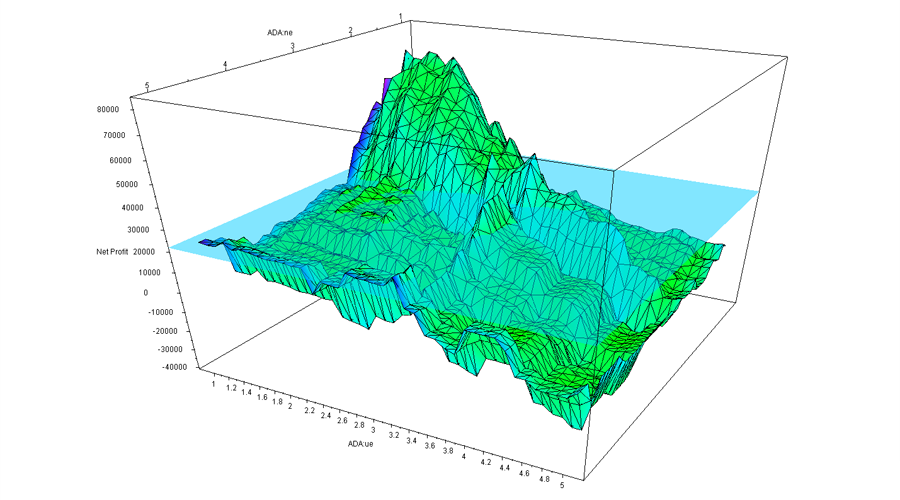
As shown in the above figure, it is a two-parameter strategy performance graph. As the parameters are different, the final results also changes greatly, and the surface is strongly distorted, forming different “peaks” and “valleys”. Usually the first result of the optimization result is the highest point of all surfaces. However, from the perspective of parameter sensitivity and objectivity, sometimes this result may not be “optimal”. Because the market is constantly changing.
Therefore, the important principle of parameter optimization is to choose the “parameter plateau” instead of the “parameter island”. The so-called “parametric plateau” refers to the existence of a wide range of parameters, and the strategy can achieve better performance within this parameter range. A normal distribution is generally formed at the center of the “plateau”. The so-called “parameter island”, referring to only when the parameter value is within a small range, the strategy will have better performance, when it is not within the range, the strategy’s performance is significantly deteriorated.

Parameter plateau
As shown in the above figure, the good strategy parameter distribution should be like the “parameter plateau”. Even if the parameter settings are deviated , the profitability of the strategy can still be guaranteed. Such parameters have strong stability, which can make the strategy have strong universality when encountering various market conditions in actual combat in the future .

Parameter island
As shown in the above figure, if the backtesting performance presents a parameter island, when the parameter has a small offset, the profitability of the strategy will be much lower. In this way, such parameter is often difficult to cope with the change in the actual trading due to poor universality.
Therefore, if the performance of nearby parameters is far worse than the performance of the optimal parameters, then this optimal parameter may be a result of over-fitting, which can be considered mathematically as a singular point solution rather than the maximum value solution to be sought. From a mathematical point of view, the singularity is unstable. In the uncertain future market, once the market characteristics changes, the optimal parameters may become the worst parameters.
Adding Filter
A lot of trend strategies, when the trend occurring, can grasp the trend very well and achieve profitable rich returns, but in the long run, the final results are alway not good, so, what’s the problem?
The reason is that the strategy is constantly trading repeatedly in the oscillating market, and most of the oscillating trading are stop-losses or small profits. According to statistics, all market has about 70% of the time is in a oscillating market, long-term continuous small losses, leading to the profit hard to accumulate.
The solution is to increase the filter mechanism. There are many kinds of filters on the market, including profit and loss filter, risk value filter, trend type filter, technical indicator filter and so on. For example, adding a large cycle moving average filter can reduce the number of transactions and filter out half of the wrong transactions in the oscillating market.
Smooth Fund Curve
Quantitative trading pursuits a stable and sustainable profit method, which is what most traders want to see. No one wants to earn 50% this year, lose 30% next year, and earn 40% again next year after that. we would rather accept each year of 20% growth, but can last for more than ten years. This is what quantitative investment can do. Because quantitative investment is a trading model with sustainable performance.

To achieve a smooth funding curve, you need a multi-strategy, multi-variety, multi-cycle, multi-parameter build portfolio. But not necessarily the more the better, there is a marginal diminishing effect. The more the combination is added at the beginning, the better the dispersion, but when the strategy reaches an order of magnitude, the effect of diminishing dispersion begins to appear. The benefit of the combination is dispersion, although the overall rate of return is not the highest, but the most robust.
Give up on looking for the Holy Grail
Whether or not we can use the quantitative trading to find the Holy Grail is a problem that many traders will consider. Some traders took a simple backtesting so-called perfect strategy rushed into the market. hoping can win over and over again and become a professional quants.
But is there a holy grail? In fact, it is very simple, the answer is no. it is not difficult to understand. If the market is really has a pattern, after all these years, eventually, people will find the rules, whether it is mathematical analysis, information monopoly, or other Analytical methods, in the end they will earn most of the money in the market, and in the long run, these people will monopolize the trading market until the market is not functioning properly.
To sum up
If the trading time is long enough, anyone may face a variety of market trends during the trading process, and these trends are not likely to be completely repeated. As a quantitative trader, in addition to correctly reviewing and optimizing your trading strategy, it is also necessary to continuously monitor the market status and continuously improve the strategy in response to changes in the market.
At the same time, we must also realize that the profit and loss are homologous. Loss is part of the overall trading progress. Even the best trading strategy may go through a series of retracement periods. When each transaction has a loss, your shouldn’t question your trading rules and strategies all the time. At the very least, don’t change your strategy logic framework easily, unless your logical framework is wrong at first.
After-school exercises
- Build a portfolio based on the characteristics of your strategy and use the FMZ Quant platform to backtest it
- Try to optimize your own quantitative trading strategy based on the content of this section.