Speaking of hedging strategies, there are various types, diverse combinations, and diverse ideas in various markets. We explore the design ideas and concepts of the hedging strategy from the most classic intertemporal hedging. Today, the crypto currency market is much more active than at the beginning, and there are also many futures contract exchanges that offer plenty of opportunities for arbitrage hedging. Spot cross-market arbitrage, cash hedge arbitrage, futures intertemporal arbitrage, futures cross-market arbitrage, etc., crypto quantitative trading strategies emerge one after another. Let’s take a look at a “hardcore” intertemporal hedging strategy written in C++ and trading on the OKEX exchange. The strategy is based on the FMZ Quant quantitative trading platform.
Principle of strategy
Why is the strategy somewhat hardcore because the strategy is written in C++ and the strategy reading is slightly more difficult. But it does not prevent readers from learning the essence of this strategy design and ideas. The strategy logic is relatively simple, the code length is moderate, only 500 lines. In terms of market data acquisition, unlike the other strategies that use the “rest” interface. This strategy uses the “websocket” interface to accept exchange market quotes.
In terms of design, the strategy structure is reasonable, the code coupling degree is very low, and it is convenient to expand or optimize. The logic is clear, and such a design is not only easy to understand. As a teaching material, learning this strategy’s design is also a good example. The principle of this strategy is relatively simple, that is, does the spread of forward contract and recent contract are positive or negative? the basic principle is consistent with the intertemporal hedging of commodity futures.
- Spread Positive, selling short forward contracts, buying long recent contracts.
- Spread negative, buying long forward contracts, selling short recent contracts.
after understand the basic principles, the rest is how the strategy triggers the opening position of the hedge, how to close the position, how to add positions, total position control method and other strategy details processing.
The hedging strategy is mainly concerned with the fluctuation of the subject price difference (The Spread) and the regression of it. However, the difference is likely to fluctuate slightly, or to oscillate sharply, or in one direction.
This brings uncertainty about hedging profits and losses, but the risk is still much smaller than the unilateral trend. For the various optimizations of the intertemporal strategy, we can choose to start from the position controlling level and the opening and closing trigger condition. For example, we can use the classic “Bollinger band Indicator” to determine the price fluctuation. Due to the reasonable design and low coupling degree, this strategy can be easily modified into the “Bollinger index intertemporal hedging strategy”
Analysis of strategy code
Looking at the code throughout, you can conclude that the code is roughly divided into four parts.
- Enumerate value definitions, define some state values, and use to mark states. Some functional functions that are not related to the strategy, such as url encoding functions, time conversion functions, etc., have no relationship with the strategy logic, just for the data processing.
- K-line data generator class: The strategy is driven by the K-line data generated by the generator class object.
- Hedging class: Objects of this class can perform specific trading logic, hedging operations, and processing details of the strategy.
- The main function of the strategy, which is the “main” function. The main function is the entry function of the strategy. The main loop is executed inside this function. In addition, this function also performs an important operation, that is, accessing the websocket interface of the exchange, and obtaining the pushed raw tick market data as the K-line data generator.
Through the overall understanding of the strategy code, we can gradually learn the various aspects of the strategy, and then study the design, ideas and skills of the strategy.
- Enumeration value definition, other function functions
- enumerated type
Statestatement
enum State {                    // Enum type defines some states
    STATE_NA,                   // Abnormal state
    STATE_IDLE,                 // idle
    STATE_HOLD_LONG,            // holding long positions
    STATE_HOLD_SHORT,           // holding short positions
};
Because some functions in the code return a state, these states are defined in the enumeration type State.
Seeing that STATE_NA appears in the code is abnormal, and STATE_IDLE is idle, that is, the state of the operation can be hedged. STATE_HOLD_LONG is the state in which the positive hedge position is held. STATE_HOLD_SHORT is the state in which the negative hedge position is held.
- String substitution, not called in this strategy, is an alternate utility function, mainly dealing with strings.
string replace(string s, const string from, const string& to)
- A Function for converting to hexadecimal characters
toHex
inline unsigned char toHex(unsigned char x)
- Handling url encoded functions
std::string urlencode(const std::string& str)
- A time conversion function that converts the time in string format to a timestamp.
uint64_t _Time(string &s)
- K line data generator class
Class BarFeeder { // K line data generator class
    Public:
        BarFeeder(int period) : _period(period) { // constructor with argument "period" period, initialized in initialization list
            _rs.Valid = true; // Initialize the "Valid" property of the K-line data in the constructor body.
        }

        Void feed(double price, Chart *c=nullptr, int chartIdx=0) { // input data, "nullptr" null pointer type, "chartIdx" index default parameter is 0
            Uint64_t epoch = uint64_t(Unix() / _period) * _period * 1000; // The second-level timestamp removes the incomplete time period (incomplete _period seconds) and is converted to a millisecond timestamp.
            Bool newBar = false; // mark the tag variable of the new K line Bar
            If (_rs.size() == 0 || _rs[_rs.size()-1].Time < epoch) { // If the K line data is 0 in length. Or the last bar's timestamp is less than epoch (the last bar of the K line is more than the current most recent cycle timestamp)
                Record r; // declare a K line bar structure
                r.Time = epoch; // Construct the K line bar of the current cycle
                r.Open = r.High = r.Low = r.Close = price; // Initialize the property
                _rs.push_back(r); // K line bar is pressed into the K line data structure
                If (_rs.size() > 2000) { // If the K-line data structure length exceeds 2000, the oldest data is removed.
                    _rs.erase(_rs.begin());
                }
                newBar = true; // tag
            } else { // In other cases, it is not the case of a new bar.
                Record &r = _rs[_rs.size() - 1]; // Reference the data of the last bar in the data.
                r.High = max(r.High, price); // The highest price update operation for the referenced data.
                r.Low = min(r.Low, price); // The lowest price update operation for the referenced data.
                r.Close = price; // Update the closing price of the referenced data.
            }

            Auto bar = _rs[_rs.size()-1]; // Take the last column data and assign it to the bar variable
            Json point = {bar.Time, bar.Open, bar.High, bar.Low, bar.Close}; // Construct a json type data
            If (c != nullptr) { // The chart object pointer is not equal to the null pointer, do the following.
               If (newBar) { // judge if the new Bar appears
                    C->add(chartIdx, point); // Call the chart object member function add to insert data into the chart object (new k line bar)
                    C->reset(1000); // retain only 1000 bar of data
                } else {
                    C->add(chartIdx, point, -1); // Otherwise update (not new bar), this point (update this bar).
                }
            }
        }
        Records & get() { // member function, method for getting K line data.
            Return _rs; // Returns the object's private variable _rs . (ie generated K-line data)
        }
    Private:
        Int _period;
        Records _rs;
};
This class is mainly responsible for processing the acquired tick data into a difference K line for driving the strategy hedging logic.
Some readers may have questions, why use tick data? Why construct a K-line data generator like this? Is it not good to use K-line data directly? This kind of question has been issued in three bursts. When I wrote some hedging strategies, I also made a fuss. I found the answer when I wrote the “Bollinger hedge strategy”. Since the K-line data for a single contract is the price change statistics for this contract over a certain period of time.
The K-line data of the difference between the two contracts is the difference price change statistics in a certain period. Therefore, it is not possible to simply take the K-line data of each of the two contracts for subtraction and calculate the difference of each data on each K-line Bar. The most obvious mistake is, for example, the highest price and the lowest price of two contracts, not necessarily at the same time. So the subtracted value doesn’t make much sense.
Therefore, we need to use real-time tick data to calculate the difference in real time and calculate the price change in a certain period in real time (that is, the highest, lowest, open and close price on the K-line column). So we need a K-line data generator, as a class, a good separation of processing logic.
- Hedging class
Class Hedge { // Hedging class, the main logic of the strategy.
  Public:
    Hedge() { // constructor
        ...
    };

    State getState(string &symbolA, Depth &depthA, string &symbolB, Depth &depthB) { // Get state, parameters: contract A name, contract A depth data, contract B name, contract B depth data

        ...
    }
    Bool Loop(string &symbolA, Depth &depthA, string &symbolB, Depth &depthB, string extra="") { // Opening and closing position main logic

        ...
    }

  Private:
    Vector<double> _addArr; // Hedging adding position list
    String _state_desc[4] = {"NA", "IDLE", "LONG", "SHORT"}; // Status value Description
    Int _countOpen = 0; // number of opening positions
    Int _countCover = 0; // number of closing positions
    Int _lastCache = 0; //
    Int _hedgeCount = 0; // number of hedging
    Int _loopCount = 0; // loop count (cycle count)
    Double _holdPrice = 0; // holding position price
    BarFeeder _feederA = BarFeeder(DPeriod); // A contract Quote K line generator
    BarFeeder _feederB = BarFeeder(DPeriod); // B contract Quote K line generator
    State _st = STATE_NA; // Hedging type Object Hedging position status
    String _cfgStr; // chart configuration string
    Double _holdAmount = 0; // holding position amount
    Bool _isCover = false; // the tag of whether to close the position
    Bool _needCheckOrder = true; // Set whether to check the order
    Chart _c = Chart(""); // chart object and initialize
};
Because the code is relatively long, some parts are omitted, this is mainly showing the structure of this hedge class, the constructor Hedge function is omitted, mainly for the purpose the object initialization. Next, we introduce the two main “function” functions.
getState
This function mainly deals with order inspection, order cancellation, position detection, position balancing and so on. Because in the process of hedging transactions, it is impossible to avoid a single leg (that is, a contract is executed, another one is not), if the examination is performed in the placing order logic, and then the processing of the re-send order operation or closing position operation, the strategy logic will be chaotic.
So when designing this part, I took another idea. If the hedging operation is triggered, as long as the order is placed once, regardless of whether there is a single-leg hedging, the default is that the hedging is successful, and then the position balance is detected in the getState function, and the logic for processing the balance will be deal with independently.
Loop
The trading logic of the strategy is encapsulated in this function, in which getState is called, and the K-line data generator object is used to generate the K-line data of the difference(the spread), and the judgment of opening, closing, and adding position logic is performed. There are also some data update operations for the chart.
- Strategy main function
Void main() {

    ...

    String realSymbolA = exchange.SetContractType(symbolA)["instrument"]; // Get the A contract (this_week / next_week / quarter ), the real contract ID corresponding to the week, next week, and quarter of the OKEX futures contract.
    String realSymbolB = exchange.SetContractType(symbolB)["instrument"]; // ...

    String qs = urlencode(json({{"op", "subscribe"}, {"args", {"futures/depth5:" + realSymbolA, "futures/depth5:" + realSymbolB}}}).dump()) ; // JSON encoding, url encoding for the parameters to be passed on the ws interface
    Log("try connect to websocket"); // Print the information of the connection WS interface.
    Auto ws = Dial("wss://real.okex.com:10442/ws/v3|compress=gzip_raw&mode=recv&reconnect=true&payload="+qs); // Call the FMZ API "Dial" function to access the WS interface of OKEX Futures
    Log("connect to websocket success");

    Depth depthA, depthB; // Declare two variables of the depth data structure to store the depth data of the A contract and the B contract
    Auto fillDepth = [](json &data, Depth &d) { // Construct the code for the Depth data with the json data returned by the interface.
        d.Valid = true;
        d.Asks.clear();
        d.Asks.push_back({atof(string(data["asks"][0][0]).c_str()), atof(string(data["asks"][0][1]).c_str( ))});
        d.Bids.clear();
        d.Bids.push_back({atof(string(data["bids"][0][0]).c_str()), atof(string(data["bids"][0][1]).c_str( ))});
    };
    String timeA; // time string A
    String timeB; // time string B
    While (true) {
        Auto buf = ws.read(); // Read the data pushed by the WS interface

        ...

}
After the strategy is started, it is executed from the main function. In the initialization of the main function, the strategy subscribes to the tick market of the websocket interface. The main job of the main function is to construct a main loop that continuously receives the tick quotes pushed by the exchange’s websocket interface, and then calls the member function of the hedge class object: Loop function. The trading logic in the Loop function is driven by the market data.
One point to note is that the tick market mentioned above is actually the subscription order thin depth data interface, which is the order book data for each file. However, the strategy only uses the first file of data, in fact, it is almost the same as the tick market data. The strategy does not use the data of other files, nor does it use the order value of the first file.
Take a closer look at how the strategy subscribes to the data of the websocket interface and how it is set up.
string qs = urlencode(json({{"op", "subscribe"}, {"args", {"futures/depth5:" + realSymbolA, "futures/depth5:" + realSymbolB}}}).dump());
Log("try connect to websocket");
auto ws = Dial("wss://real.okex.com:10442/ws/v3|compress=gzip_raw&mode=recv&reconnect=true&payload="+qs);
Log("connect to websocket success");
First, the url encoding of the subscription message json parameter passed by the subscribed interface, that is, the value of the payload parameter. Then an important step is to call the FMZ Quant platform’s API interface function Dial function. The Dial function can be used to access the exchange’s websocket interface. Here we make some settings, let the websocket connection control object ws to be created have automatic reconnection of disconnection (the subscription message still uses the value qs string of the payload parameter), to achieve this function, you need to add configuration in the parameter string of the Dial function.
The beginning of the Dial function parameter is as follows:
wss://real.okex.com:10442/ws/v3
this is the address of the websocket interface that needs to be accessed, and is separated by “|”.
Compress=gzip_raw&mode=recv&reconnect=true&payload="+qs are all configuration parameters.
| Parameter name | Description |
| compress | Compress is compression mode, OKEX websocket interface uses gzip_raw this way, so it is set to gzip_raw |
| mode | Mode is mode, optional dual, send and recv three kind. Dual is bidirectional, sending compressed data and receiving compressed data. Send is to send compressed data. Recv receives the compressed data and decompresses it locally. |
| reconnect | Reconnect is set to reconnect, reconnect=true to enable reconnection, no default is not reconnected. |
| payload | The payload is a subscription message that needs to be sent when ws is reconnected. |
After this setting, even if the websocket connection is disconnected, FMZ Quant trading platform’s underlying system of the docker system will automatically reconnect and get the latest market data in time.
Grab every price fluctuation and quickly capture the right hedge.
- Position control
Position control is controlled using a ratio of hedge positions similar to the “Bofinacci” series.
For (int i = 0; i < AddMax + 1; i++) { // Construct a data structure that controls the number of scalping, similar to the ratio of the Bofinac sequence to the number of hedges.
     If (_addArr.size() < 2) { // The first two added positions are changed as: Double the number of hedges
         _addArr.push_back((i+1)*OpenAmount);
     }
     _addArr.push_back(_addArr[_addArr.size()-1] + _addArr[_addArr.size()-2]); // The last two adding positions are added together, and the current position quantity is calculated and stored in the "_addArr" data structure.
}
It can be seen that the number of additional positions added each time is the sum of the last two positions.
Such position control can realize the larger the difference, the relative increase of the arbitrage hedge, and the dispersion of the position, so as to grasp the small position of the small price fluctuation, and the large price fluctuation position is appropriately increased.
- Closing position: stop loss and take profit
Fixed stop loss spread and take profit spread.
When the position difference reaches the take profit position and the stop loss position, the take profit and stop loss are carried out.
- The designing of entering the market and leaving the market
The period of the parameter NPeriod control provides some dynamic control over the opening and closing position of the strategy.
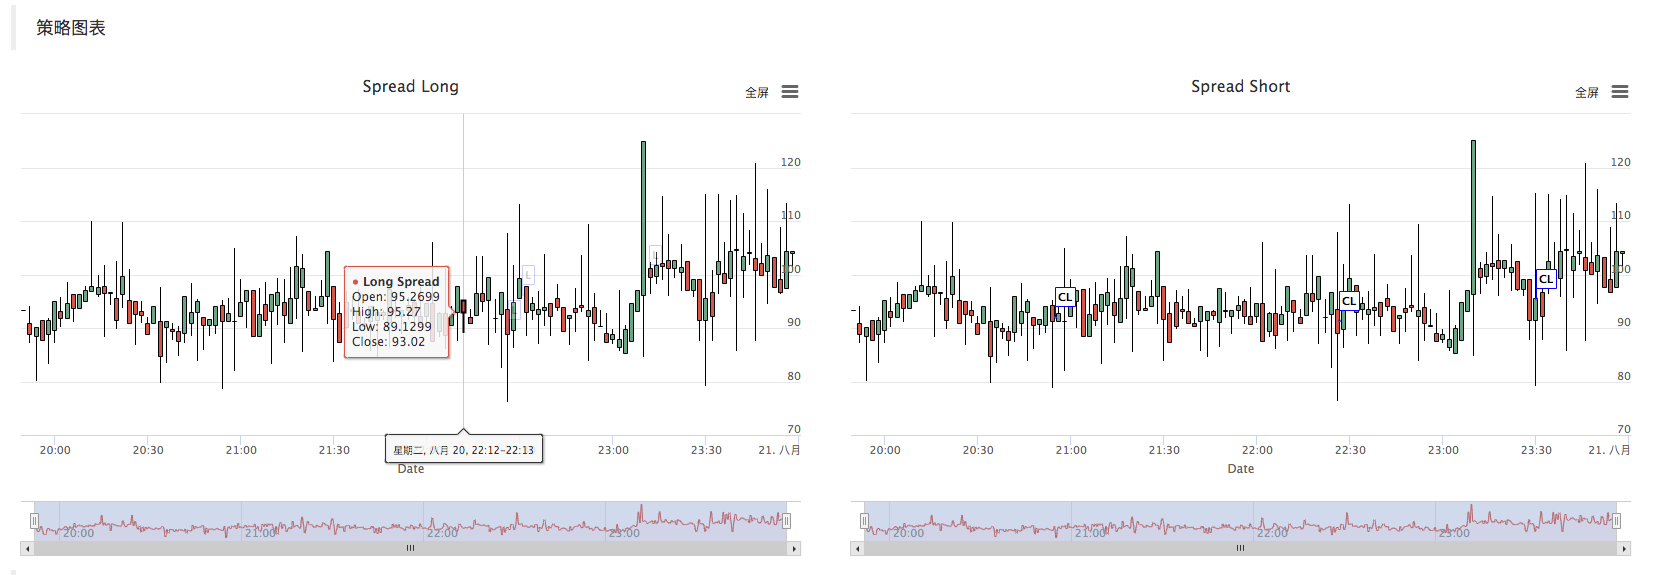
- Strategy chart
The strategy automatically generates a spread K-line chart to mark relevant transaction information.
C++ strategy custom chart drawing operation is also very simple. You can see that in the constructor of the hedge class, we use the written chart configuration string _cfgStr to configure the chart object _c, _c is the private component of the hedge class. When the private member is initialized, the chart object constructed by the FMZ Quant platform custom chart API interface function is called.
_cfgStr = R"EOF(
[{
"extension": { "layout": "single", "col": 6, "height": "500px"},
"rangeSelector": {"enabled": false},
"tooltip": {"xDateFormat": "%Y-%m-%d %H:%M:%S, %A"},
"plotOptions": {"candlestick": {"color": "#d75442", "upColor": "#6ba583"}},
"chart":{"type":"line"},
"title":{"text":"Spread Long"},
"xAxis":{"title":{"text":"Date"}},
"series":[
    {"type":"candlestick", "name":"Long Spread","data":[], "id":"dataseriesA"},
    {"type":"flags","data":[], "onSeries": "dataseriesA"}
    ]
},
{
"extension": { "layout": "single", "col": 6, "height": "500px"},
"rangeSelector": {"enabled": false},
"tooltip": {"xDateFormat": "%Y-%m-%d %H:%M:%S, %A"},
"plotOptions": {"candlestick": {"color": "#d75442", "upColor": "#6ba583"}},
"chart":{"type":"line"},
"title":{"text":"Spread Short"},
"xAxis":{"title":{"text":"Date"}},
"series":[
    {"type":"candlestick", "name":"Long Spread","data":[], "id":"dataseriesA"},
    {"type":"flags","data":[], "onSeries": "dataseriesA"}
    ]
}
]
)EOF";
_c.update(_cfgStr);                 // Update chart objects with chart configuration
_c.reset();                         // Reset chart data。
Call _c.update(_cfgStr); Use _cfgStr to configure to the chart object.

Call _c.reset(); to reset the chart data.
When the strategy code needs to insert data into the chart, it also calls the member function of the _c object directly, or passes the reference of _c as a parameter, and then calls the object member function (method) of _c to update the chart data and insert operation.
E.g:
_c.add(chartIdx, {{"x", UnixNano()/1000000}, {"title", action}, {"text", format("diff: %f", opPrice)}, {"color", color}});
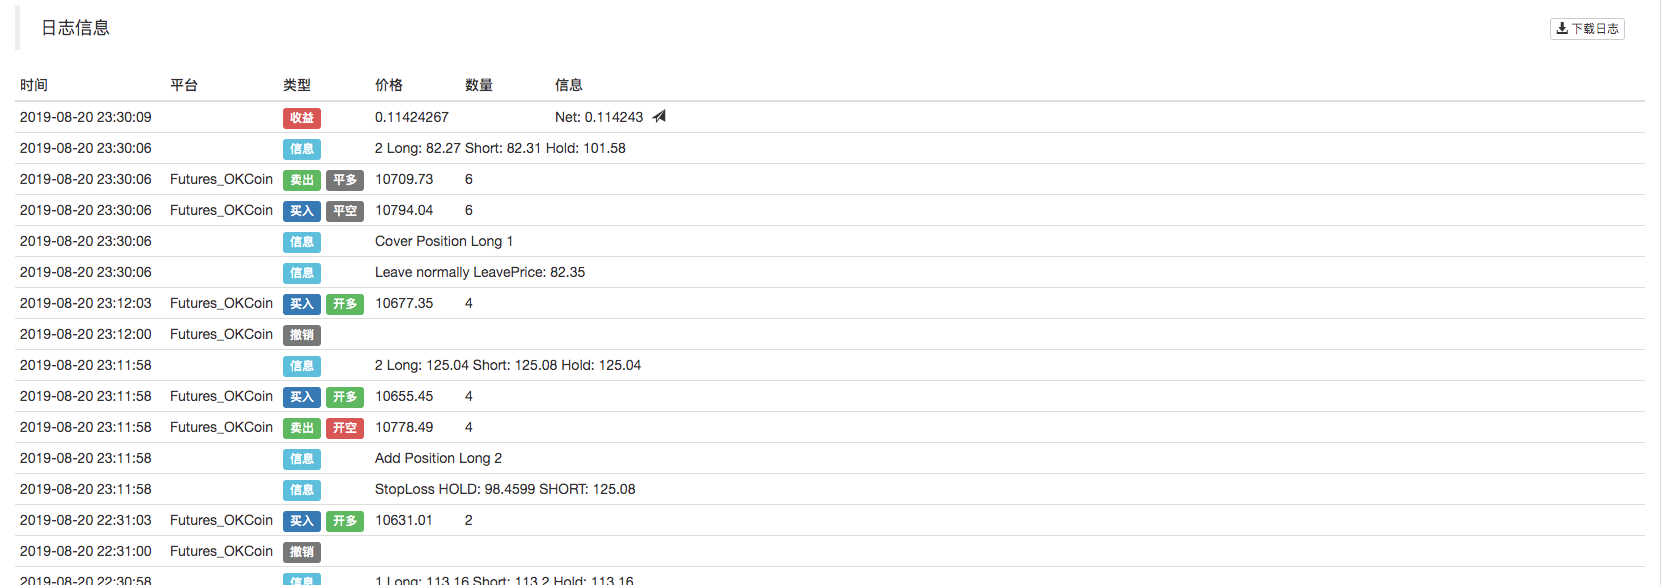
After placing the order, mark the K line chart.
As follows, when drawing a K line, a reference to the chart object _c is passed as a parameter when calling the member function feed of the BarFeeder class.
void feed(double price, Chart *c=nullptr, int chartIdx=0)
That is, the formal parameter c of the feed function.
Json point = {bar.Time, bar.Open, bar.High, bar.Low, bar.Close}; // Construct a json type data
If (c != nullptr) { // The chart object pointer is not equal to the null pointer, do the following.
    If (newBar) { // judge if the new Bar appears
         C->add(chartIdx, point); // Call the chart object member function "add" to insert data into the chart object (new k line bar)
         C->reset(1000); // only keep 1000 bar data
     } else {
         C->add(chartIdx, point, -1); // Otherwise update (not new bar), this point (update this bar).
     }
}
Insert a new K-line Bar data into the chart by calling the add member function of the chart object _c.
c->add(chartIdx, point);
Backtest
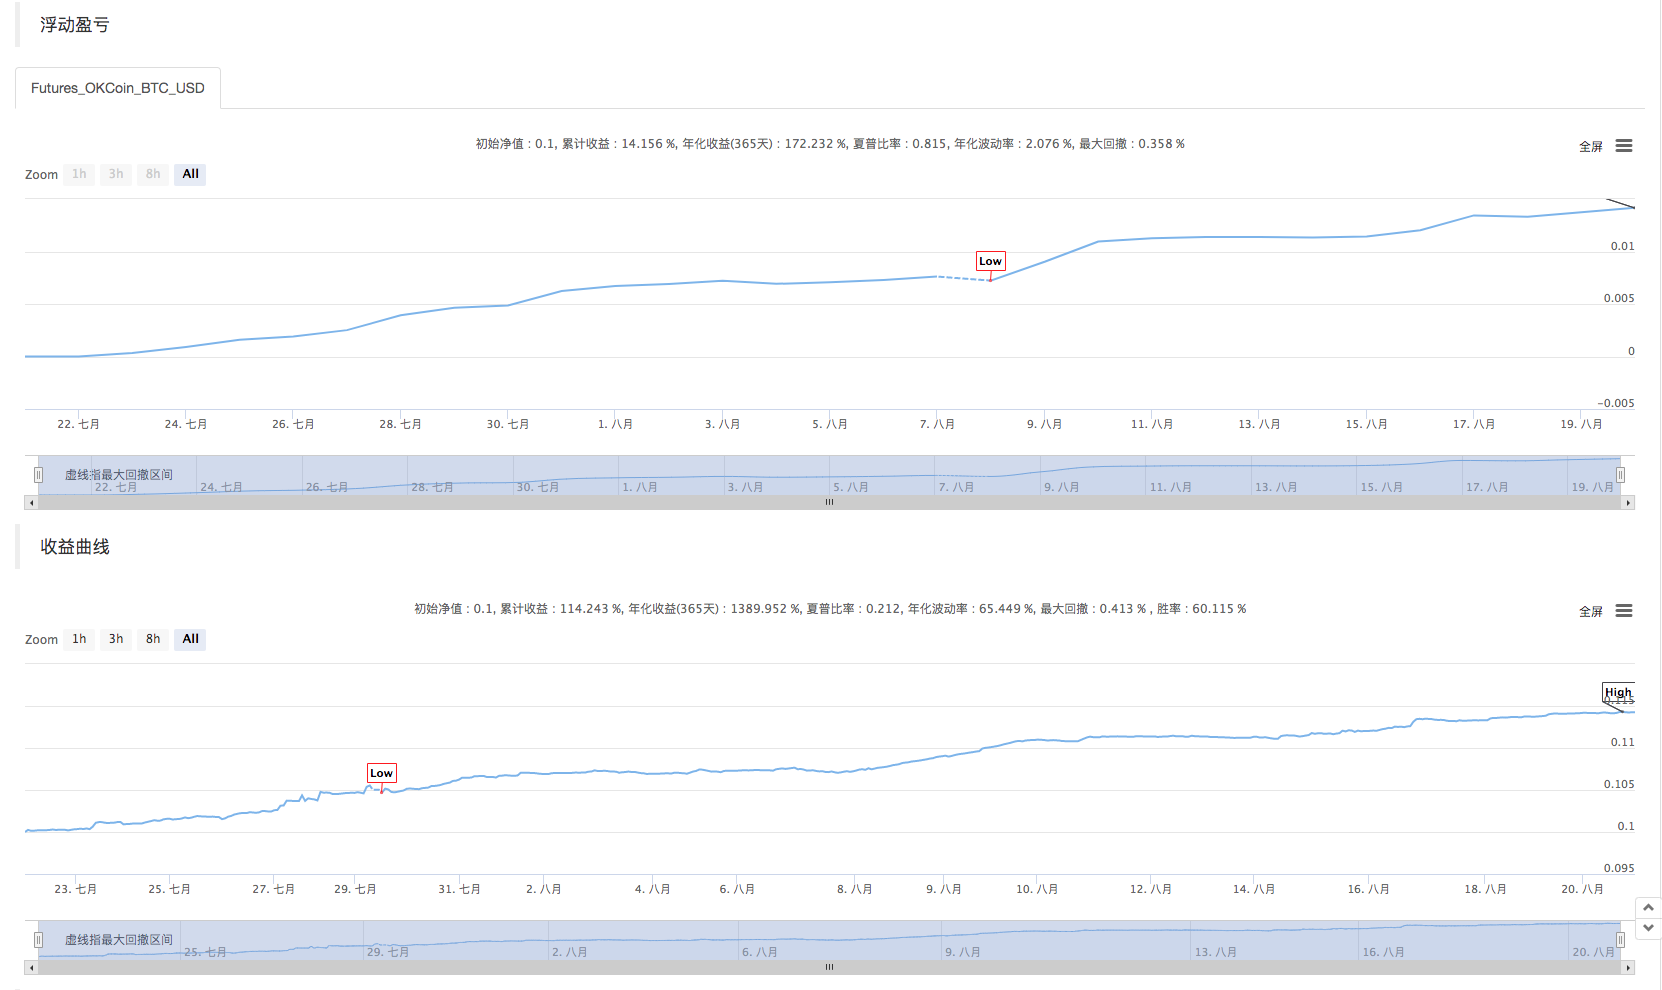
This strategy is only for learning and communication purposes. When apply it in the real market, please modify and optimize according to the actual situation of the market.
Strategy address: https://www.fmz.com/strategy/163447
More interesting strategies are in the FMZ Quant platform”: https://www.fmz.com