
When writing a quantitative trading strategy, using the K-line data, there are often cases where non-standard cycle K-line data is required. For example, 12-minute cycle K-line data and 4-hour K-line cycle data are required. Usually such non-standard Cycles are not directly available. So how do we deal with such needs?
The non-standard cycle K line data can be obtained by combining the data of the smaller cycle. Image this, the highest price in multiple cycles is counted as the highest price after the multiple cycle K line synthesis, and the lowest price is calculated as the lowest price after the synthesis, and the opening price does not change. The first opening price of the raw material data of the K-line is synthesized. The closing price corresponds to the closing price of the last raw material data of the K-line. The time uses the time of the opening price k line. The transaction volume uses the raw material data that summed and calculated.
As shown in the figure:
- Thought
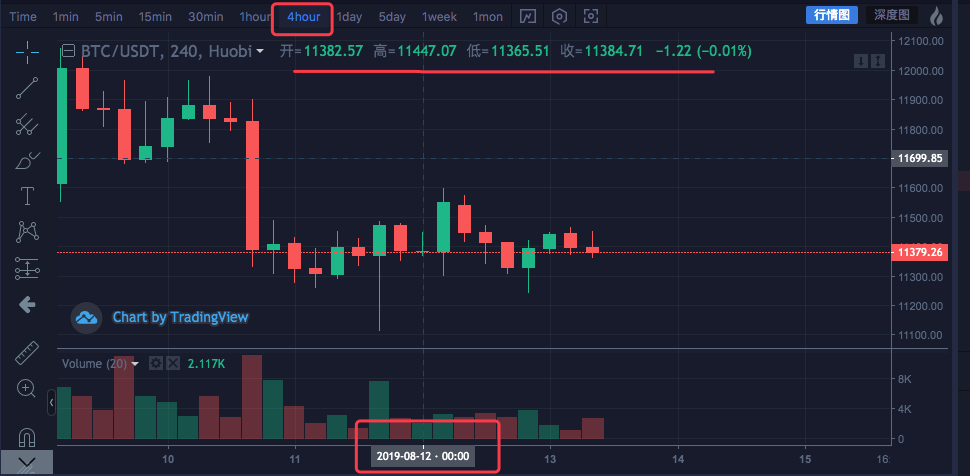
Let’s take the blockchain asset BTC_USDT as an example and synthesize 1 hour into 4 hours.
| Time | Highest | Open | Lowest | Close |
|---|---|---|---|---|
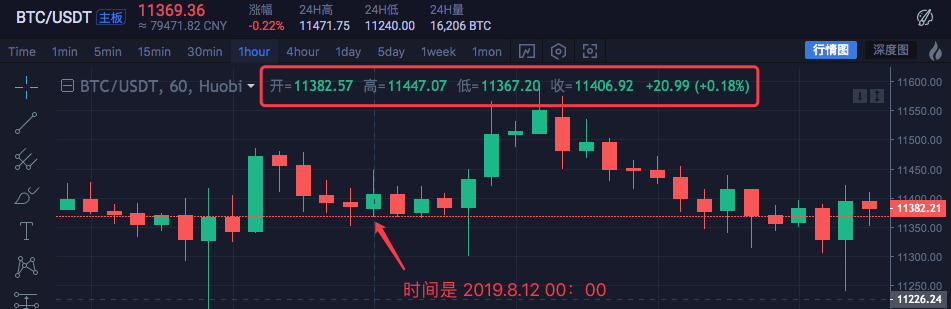
| 2019.8.12 00:00 | 11447.07 | 11382.57 | 11367.2 | 11406.92 |
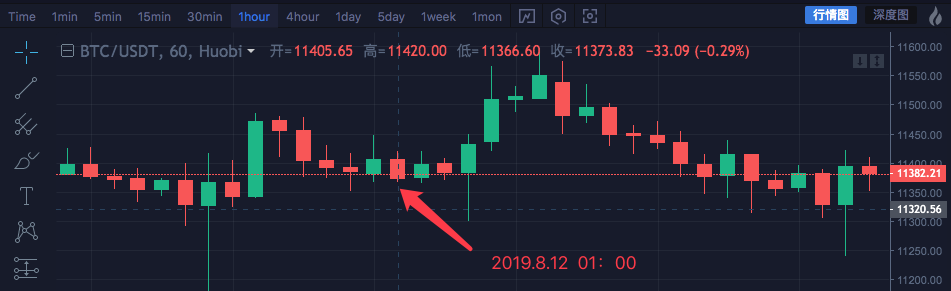
| 2019.8.12 01:00 | 11420 | 11405.65 | 11366.6 | 11373.83 |
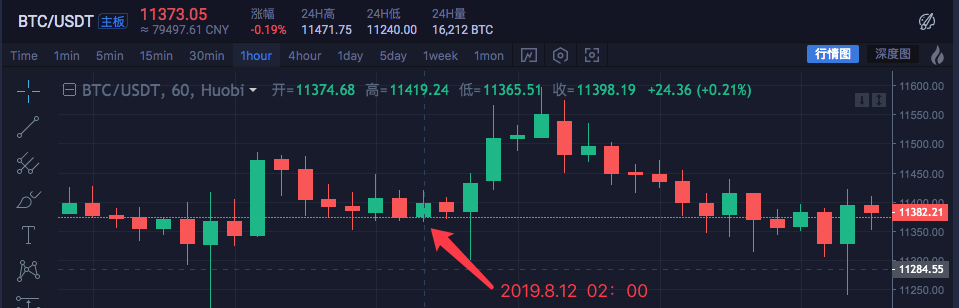
| 2019.8.12 02:00 | 11419.24 | 11374.68 | 11365.51 | 11398.19 |
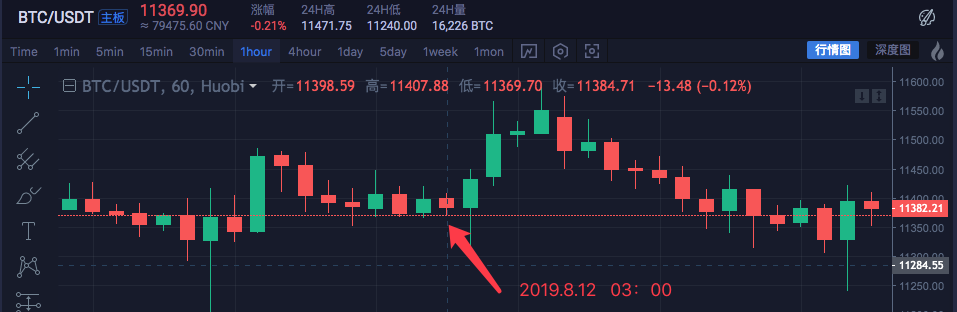
| 2019.8.12 03:00 | 11407.88 | 11398.59 | 11369.7 | 11384.71 |
The data of four 1-hour cycles is combined into a single 4-hour cycle data.
The opening price is the first K line opening price at 00:00 time: 11382.57
The closing price is the last k line closing price at 03:00: 11384.71
The highest price is to find the highest price among them: 11447.07
The lowest price is to find the lowest price among them: 11365.51
Note: China Commodity Futures Market closed at 3:00 PM on a normal trading day
The 4-hour cycle Start time is the start time of the first 1-hour K-line, ie 2019.8.12 00:00
The sum of the volume of all 1 hour k line are used as this 4 hour k line volume.
A 4-hour K-line is synthesized:
High: 11447.07
Open: 11382.57
Low: 11365.51
Close: 11384.71
Time: 209.8.12 00:00
You can see that the data is consistent.
- Code implementation
After understanding the initial ideas, you can manually write the code to realize the requirements.
These code are for references only:
Function GetNewCycleRecords (sourceRecords, targetCycle) { // K line synthesis function
      Var ret = []

      / / First get the source K line data cycle
      If (!sourceRecords || sourceRecords.length < 2) {
          Return null
      }
      Var sourceLen = sourceRecords.length
      Var sourceCycle = sourceRecords[sourceLen - 1].Time - sourceRecords[sourceLen - 2].Time

      If (targetCycle % sourceCycle != 0) {
          Log("targetCycle:", targetCycle)
          Log("sourceCycle:", sourceCycle)
          Throw "targetCycle is not an integral multiple of sourceCycle."
      }

      If ((1000 * 60 * 60) % targetCycle != 0 && (1000 * 60 * 60 * 24) % targetCycle != 0) {
          Log("targetCycle:", targetCycle)
          Log("sourceCycle:", sourceCycle)
          Log((1000 * 60 * 60) % targetCycle, (1000 * 60 * 60 * 24) % targetCycle)
          Throw "targetCycle cannot complete the cycle."
      }

      Var multiple = targetCycle / sourceCycle


      Var isBegin = false
      Var count = 0
      Var high = 0
      Var low = 0
      Var open = 0
      Var close = 0
      Var time = 0
      Var vol = 0
      For (var i = 0 ; i < sourceLen ; i++) {
          // Get the time zone offset value
          Var d = new Date()
          Var n = d.getTimezoneOffset()

          If ((1000 * 60 * 60 * 24) - sourceRecords[i].Time % (1000 * 60 * 60 * 24) + (n * 1000 * 60)) % targetCycle == 0) {
              isBegin = true
          }

          If (isBegin) {
              If (count == 0) {
                  High = sourceRecords[i].High
                  Low = sourceRecords[i].Low
                  Open = sourceRecords[i].Open
                  Close = sourceRecords[i].Close
                  Time = sourceRecords[i].Time
                  Vol = sourceRecords[i].Volume

                  Count++
              } else if (count < multiple) {
                  High = Math.max(high, sourceRecords[i].High)
                  Low = Math.min(low, sourceRecords[i].Low)
                  Close = sourceRecords[i].Close
                  Vol += sourceRecords[i].Volume

                  Count++
              }

              If (count == multiple || i == sourceLen - 1) {
                  Ret.push({
                      High : high,
                      Low : low,
                      Open : open,
                      Close : close,
                      Time : time,
                      Volume : vol,
                  })
                  Count = 0
              }
          }
      }

      Return ret
  }

  // test
  Function main () {
      While (true) {
          Var r = exchange.GetRecords() // Raw data, as the basic K-line data of the synthesize K line. For example, to synthesize a 4-hour K-line, you can use the 1-hour K-line as the raw data.
          Var r2 = GetNewCycleRecords(r, 1000 * 60 * 60 * 4) // Pass the original K-line data r through the GetNewCycleRecords function, and the target cycles, 1000 * 60 * 60 * 4, ie the target synthesis cycle is 4 hours K-line data .

          $.PlotRecords(r2, "r2") // The strategy class library bar can be selected by check the line class library, and calling the $.PlotRecords line drawing class library to export the function drawing.
          Sleep(1000) // Each cycle is separated by 1000 milliseconds, preventing access to the K-line interface too much, resulting in transaction restrictions.
      }
  }
Actually, to synthesize the K line, you need two things. The first is the raw material data, that is, the K-line data of a smaller cycle. In this example, it’s the var r = exchange.GetRecords() to get the smaller cycle K line data.
The second is to figure out the size of the synthesize cycle, we use the GetNewCycleRecords function algorithm to do this, then you can finally return the data of a synthesized K-line array structure.
Please be aware of:
- The target cycle cannot be less than the cycle of the K line that you passed in the GetNewCycleRecords function as a raw material for the data. Because you can’t synthesize smaller cycle data by a larger cycle. only the other way around.
- The target cycle must be set to “cycle closed”. What is a “cycle closed”? Simply put, within one hour or within a day, the target cycle time ranges are combined to form a closed loop.
For example:
The K-line of the 12-minutes cycle starts from 0:0 every hour, the first cycle is 00:00:00 ~ 00:12:00, and the second cycle is 00:12: 00 ~ 00: 24:00, the third cycle is 00:24:00 ~ 00:36:00, the fourth cycle is 00:36:00 ~ 00:48:00, the fifth cycle is 00:48 :00 ~ 01:00:00 , which are exactly a completed one hour.
If it is a 13-minute cycle, it will be a cycle that is not closed. The data calculated by such cycle is not unique because the synthesized data differs depending on the starting point of the synthesized data.
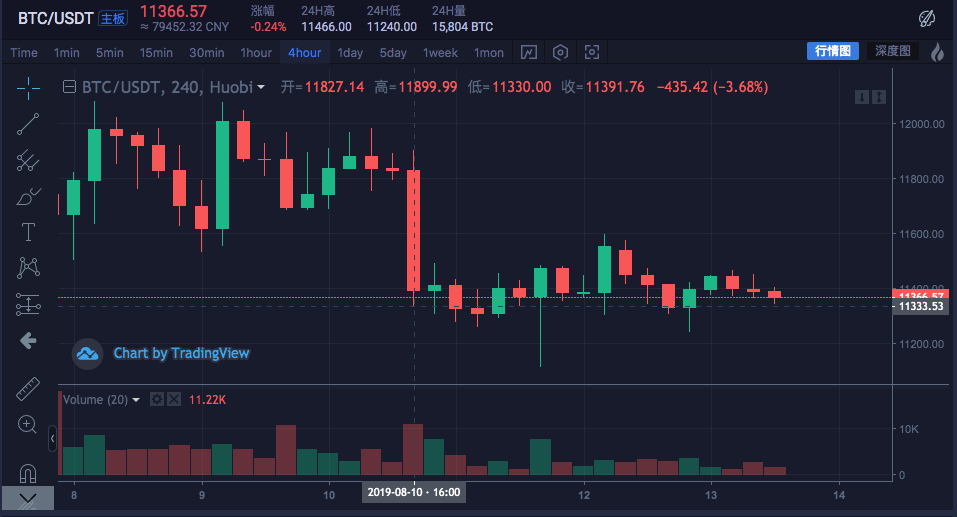
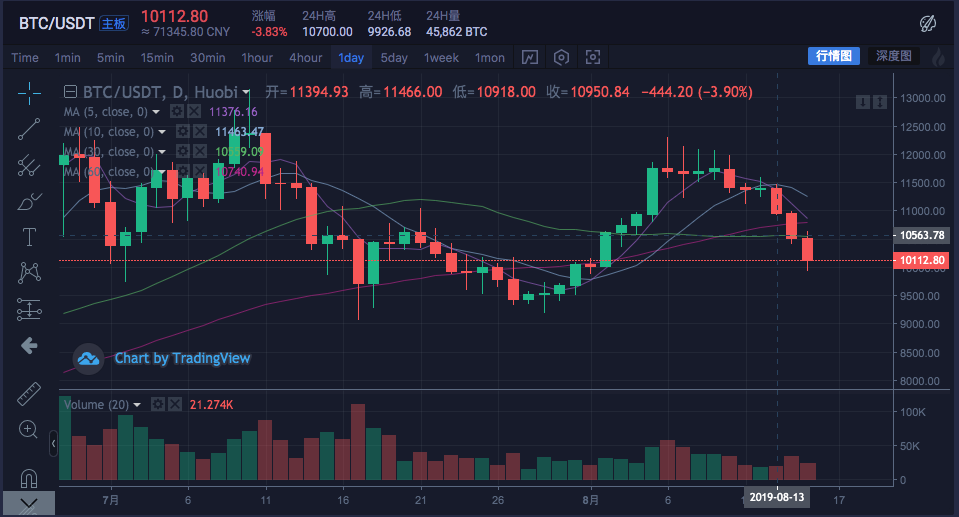
Run it in the real market:
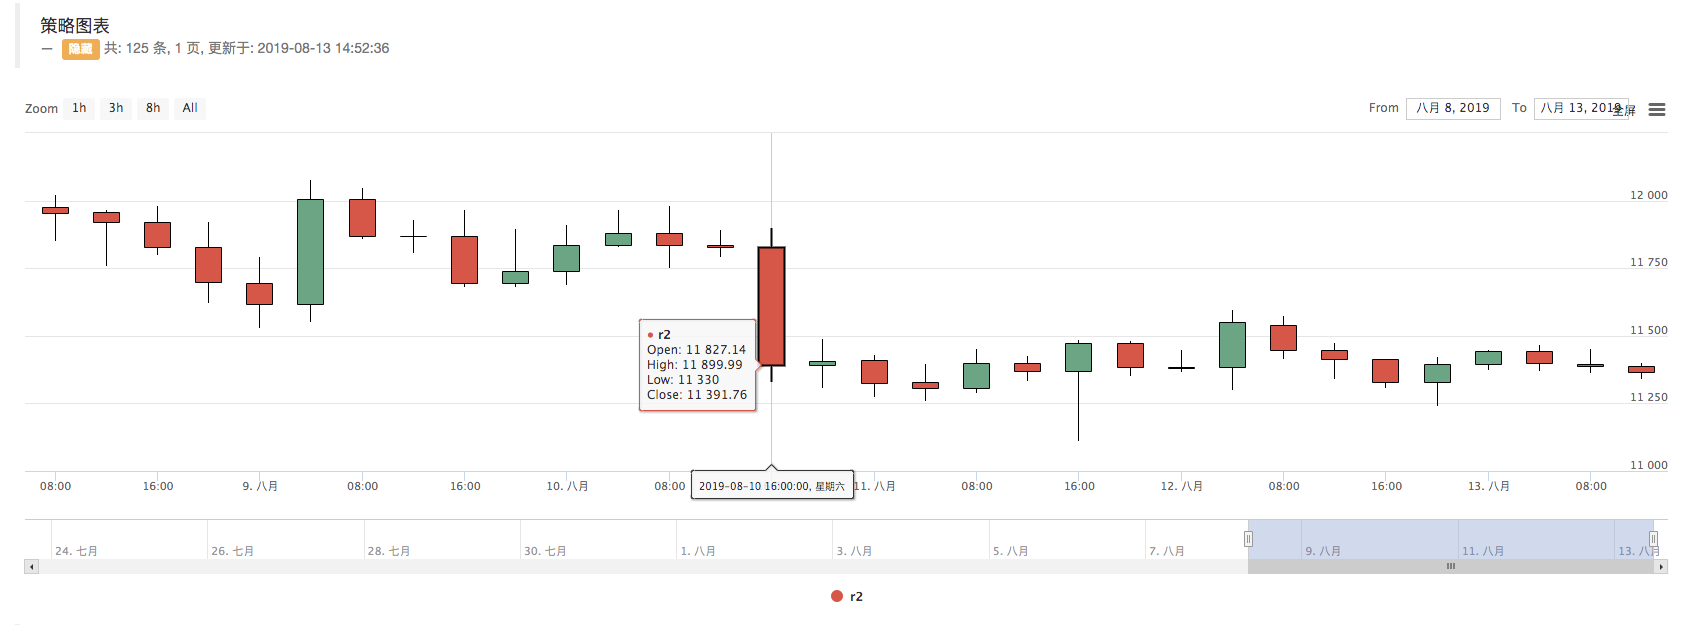
Contrast exchange chart
- Construct the required data structure using K-line data
I want to calculate the moving average of highest price for all the K lines. What should I do?
Usually, we calculate the moving averages by using the average of closing prices, but sometimes there are demand to use the highest price, the lowest price, the opening price and so on.
For these extra demands, the K line data returned by the exchange.GetRecords() function cannot be directly passed to the indicator calculation function.
E.g:
The talib.MA moving average indicator calculation function has two parameters, the first one is the data that needs to be passed in, and the second one is the indicator cycle parameter.
For example, we need to calculate the indicators as shown below.
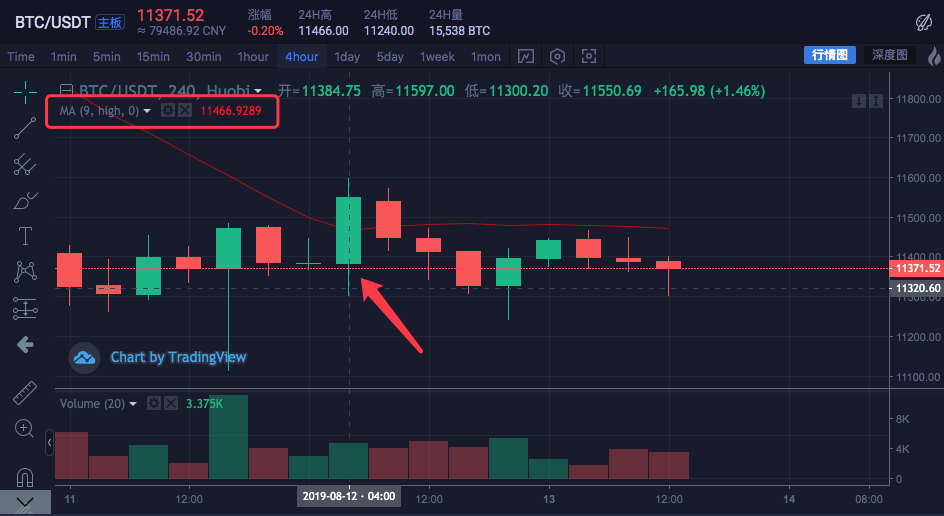
The K line cycle is 4 hours.
On the exchange market quote chart, an average line has been set with the cycle parameter of 9.
The calculated data source is using the highest price per Bar.
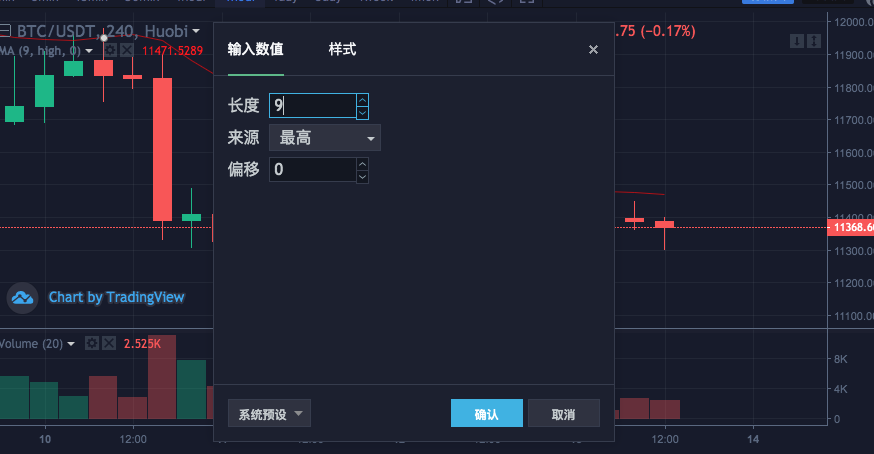
That is, this moving average line is consist of the average of the highest average price of nine 4-hour cycle K-line Bar.
Let’s build a data ourselves to see if it is the same with the exchange’s data.
var highs = []
for (var i = 0 ; i < r2.length ; i++) {
    highs.push(r2[i].High)
}
Since we need to calculate the highest price of each Bar to get the value of the moving average indicator, we need to construct an array in which each data element has the highest price for each Bar.
You can see that the highs variable is initially an empty array, then we traverse the r2 k-line data variable (don’t remember the r2? Look at the code in the main function that synthesizes the 4-hour K-line above).
Read the highest price of each Bar of r2 (ie r2[i].High, i ranges from 0 to r2.length – 1), then push into highs. This way we just constructs a data structure that corresponds one-to-one with the K-line data Bar.
At this moment, highs can pass the talib.MA function to calculate the moving average.
Complete example:
Function main () {
     While (true) {
         Var r = exchange.GetRecords()
         Var r2 = GetNewCycleRecords(r, 1000 * 60 * 60 * 4)
         If (!r2) {
             Continue
         }

         $.PlotRecords(r2, "r2") // Draw the K line

         Var highs = []
         For (var i = 0 ; i < r2.length ; i++) {
             Highs.push(r2[i].High)
         }

         Var ma = talib.MA(highs, 9) // use the moving average function "talib.MA" to calculate the moving average indicator
         $.PlotLine("high_MA9", ma[ma.length - 2], r2[r2.length - 2].Time) // Use the line drawing library to draw the moving average indicator on the chart

         Sleep(1000)
     }
}
Backtest:
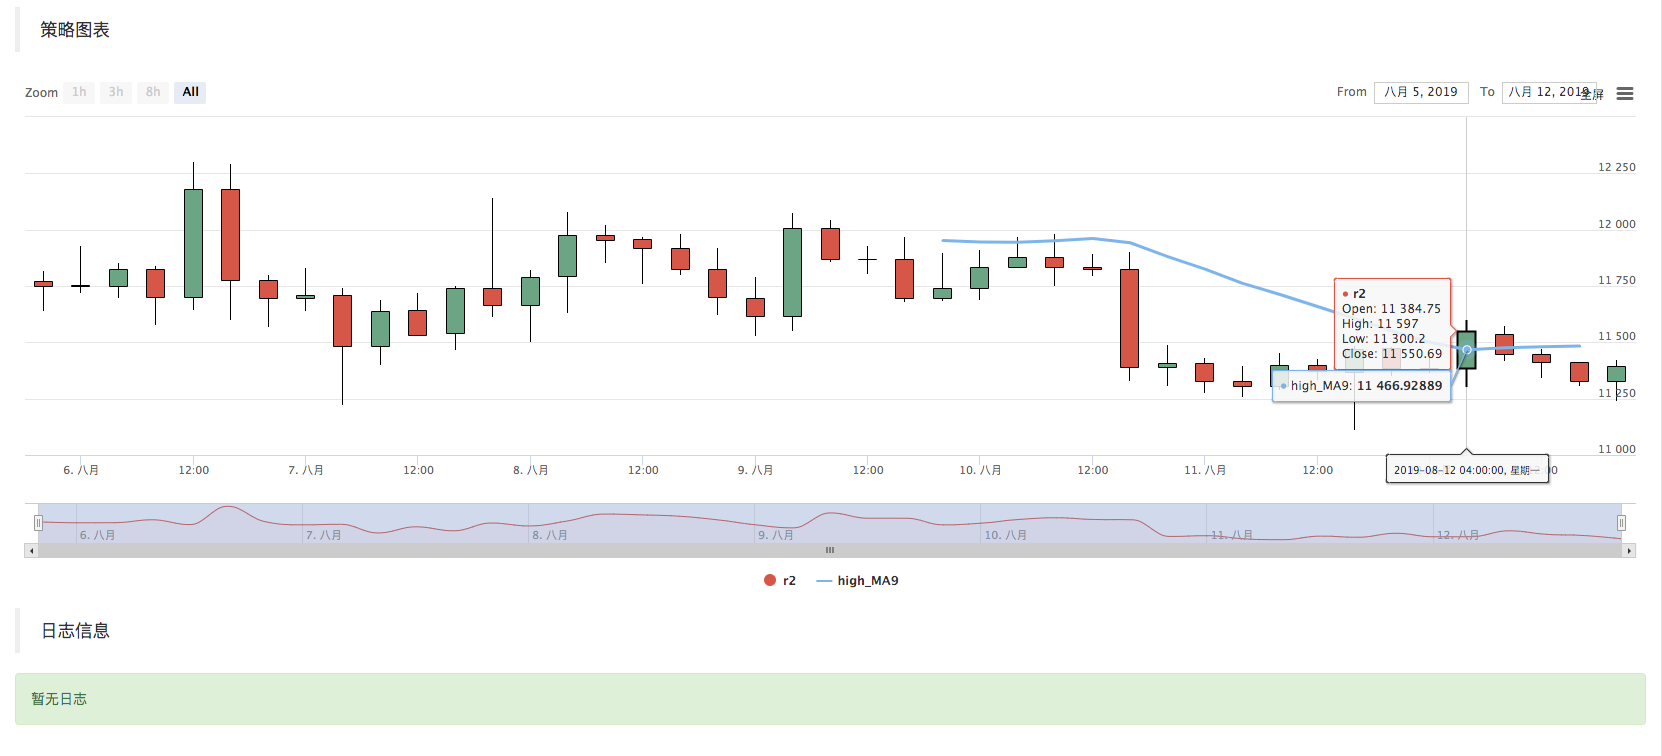
You can see that the average indicator value of the mouse point position in the figure is 11466.9289
The above code can be copied to the strategy to run the test, remember to check the “Draw Line Library” and save it!
- K-line data acquisition method for cryptocurrency market
The FMZ Quant platform already has a packaged interface, namely the
exchange.GetRecordsfunction, to get K-line data.
The following focuses on the direct access to the exchange’s K-line data interface to obtain data, because sometimes you need to specify parameters to get more K lines, the package GetRecords interface generally returns 100 k lines. If you encounter a strategy that initially requires more than 100 K-lines, you need to wait the collection process.
In order to make the strategy work as soon as possible, you can encapsulate a function, directly access the K line interface of the exchange, and specify parameters to get more K line data.
Using the BTC_USDT trading pair on Huobi exchange as an example, we implement this requirement:
Find the exchange’s API documentation and see the K-line interface description:
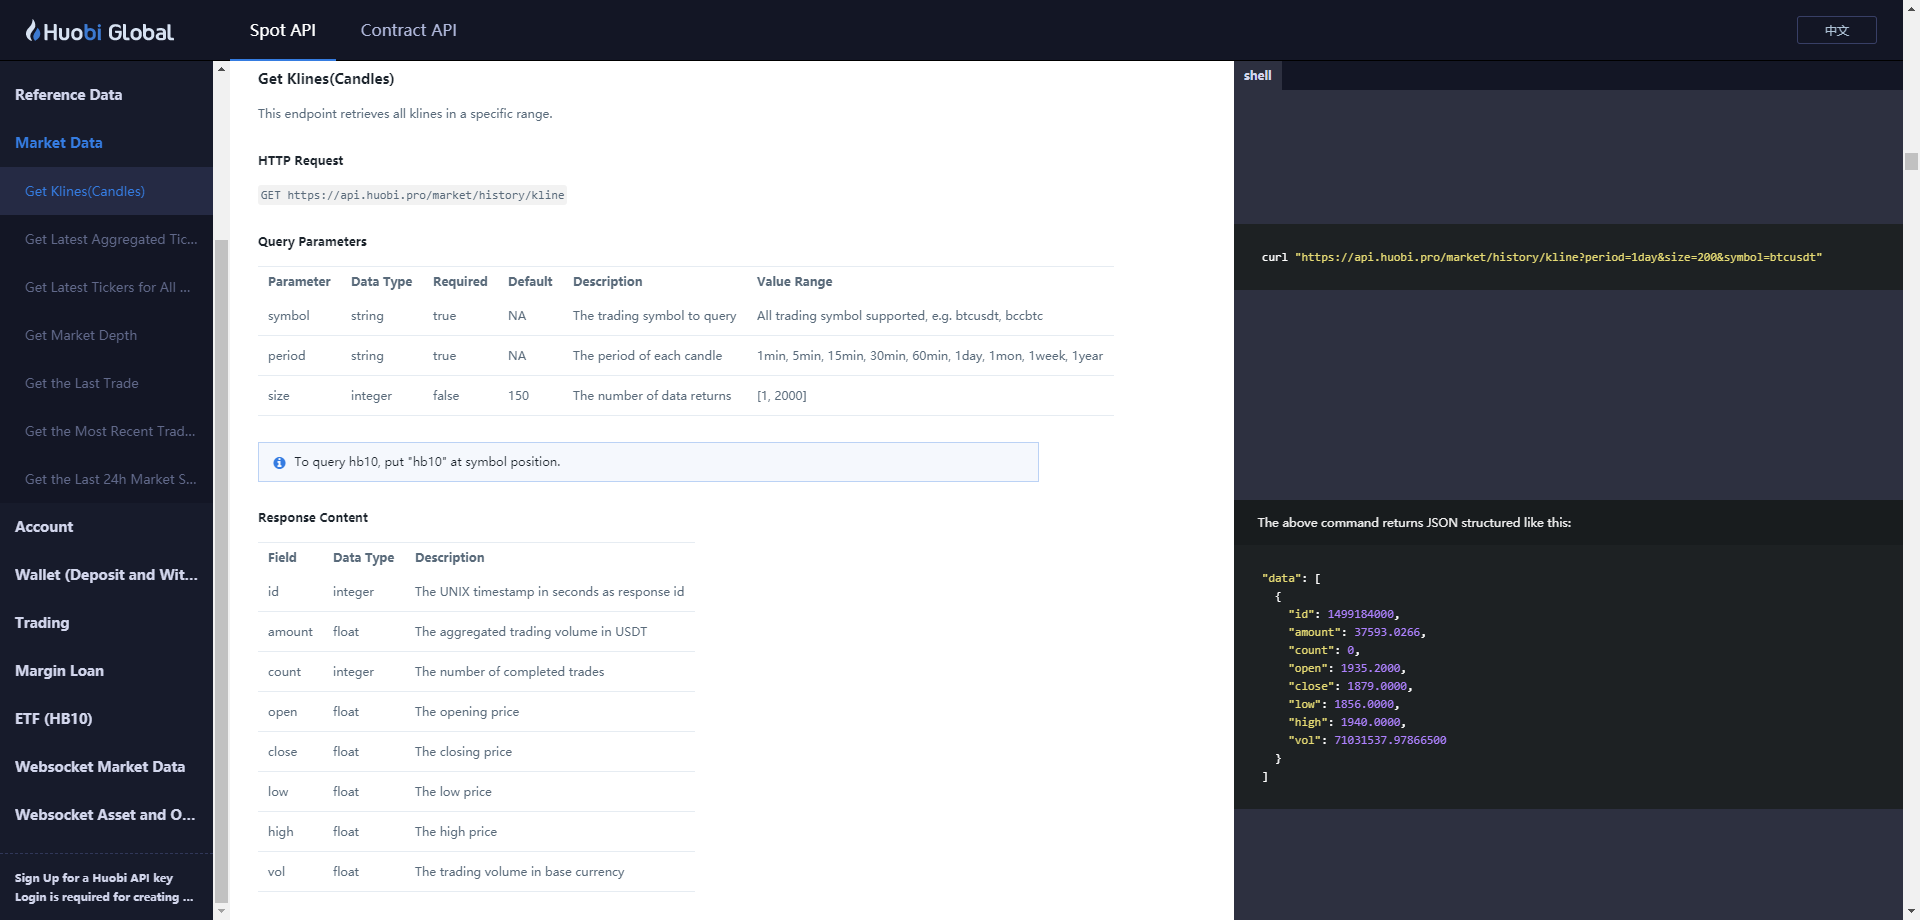
parameters:
| Name | Type | Is it necessary | Description | Value |
|---|---|---|---|---|
| symbol | string | true | Trading pair | btcusdt, ethbtc… |
| period | string | true | Returns the time granularity of the data, which is the time interval of each k line | 1min, 5min, 15min, 30min, 60min, 1day, 1mon, 1week, 1year |
| size | integer | false | Returns the number of K lines of data | [1, 2000] |
Test code:
function GetRecords_Huobi (period, size, symbol) {
    var url = "https://api.huobi.pro/market/history/kline?" + "period=" + period + "&size=" + size + "&symbol=" + symbol
    var ret = HttpQuery(url)

    try {
        var jsonData = JSON.parse(ret)
        var records = []
        for (var i = jsonData.data.length - 1; i >= 0 ; i--) {
            records.push({
                Time : jsonData.data[i].id * 1000,
                High : jsonData.data[i].high,
                Open : jsonData.data[i].open,
                Low : jsonData.data[i].low,
                Close : jsonData.data[i].close,
                Volume : jsonData.data[i].vol,
            })
        }
        return records
    } catch (e) {
        Log(e)
    }
}


function main() {
    var records = GetRecords_Huobi("1day", "300", "btcusdt")
    Log(records.length)
    $.PlotRecords(records, "K")
}
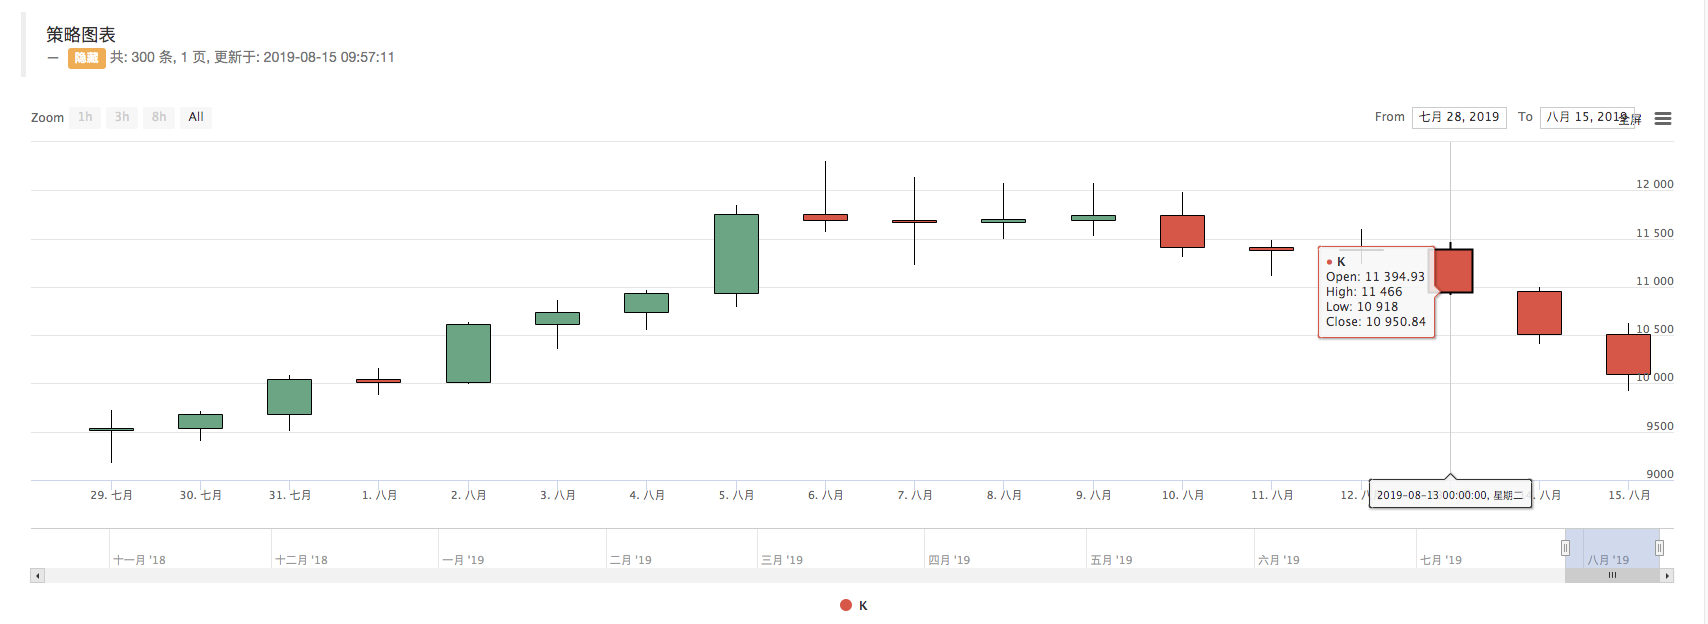

You can see that on the log, print records.length is 300, that is, the number of records K line data bar is 300.
More information, please check us at: https://www.fmz.com/digest-topic/4248