Summary
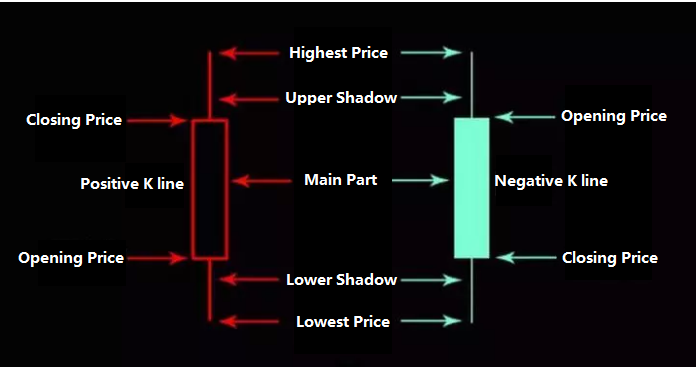
The K line itself has little value, it is just a container of the price data. Starting from the lowest Tick data stream, it is divided into segments according to the time period. The first price in each cycle is the opening price, and the last price is the closing price. The highest price and lowest price are in the middle.
Each container stores data such as high and low, volume, time and so on. This is the origin of the K-line. In this article, we will use the upper and lower shadow part of the K-line to develop a trading strategy.
What is the shadow part of the K line
The “shadow part” is the dashed line of the K line, called the upper and lower shadow part of the main part of k line, which represents the difference between the current highest or lowest price and the closing price or the opening price. The reason why the shadow is produced is because of the power competition between the two sides.
Trading is like a buying and selling power confrontation. If the bulls win the short-selling power, they will form a positive k line with no shadow part. When the short-selling force wins the bullish power, it will form a negative k line with no shadow part. If the bullish power fail after attacking the bearish power, It will form a upper shadow line. If the bearish power fail after attacking the bullish attack, it will form a lower shadow line.
Under normal circumstances, the longer the upper shadow line, the greater the resistance, the bullish is about to change from strong to weak, and the future price may fall back or fall; The longer the lower shadow line, the greater the support will be, the short position will be changed from strong to weak, and the future price may rebound or rise. Therefore, the classic K-line theory tells us that in the various K-line diagrams, if there is a long upper or lower shadow line, it is the time when the market is about to turn, which is also an important reference for judging the trend of the market.
Long upper shadow line
We know that most of the K-line has more or less upper and lower shadow lines, most of which have little meaning in judging the market trend. Therefore, when designing the strategy, it is not enough just using the upper and lower shadow lines as trading signal, we must add certain filtering conditions, reduces the frequency of opening and closing position, and increases the winning rate or profit-loss ratio of the strategy itself. Then we can judge the length of the upper shadow line, or judge the ratio of the upper shadow line to the main part k line to filter the signal. The long upper shadow line is also called the “shooting star”. Relatively speaking, the long upper shadow line is more certain than the ordinary upper shadow line. A typical example is that when the market has undergone a long-term bullish market, the price has risen sharply and then fallen sharply, and a long shadow line has been formed.
This situation indicates that the current market may have a reversal of the upward trend at any time, entering a downward trend. In general, the probability of the appearance of the upper shadow line is low. Once the upper shadow line is longer than the main part k line plus the lower shadow line, it means that the market’s strongest rising expectation is completely shattered, and the probability of the market going down is greatly increased. However, when using the long shadow line to judge the market, there needs to be a premise, that is, the market has experienced a large increase before, and accumulated a large decline in energy.
Long lower shadow line
On the contrary, we can also judge the length of the lower shadow line, or judge the ratio of the lower shadow line to the main part k line to filter the trading signal. The appearance of the long lower shadow line indicates that the bullish power is extremely powerful, not only blocking the attack of the selling power, but also recovering the “lost battlefield”. Therefore, the long lower shadow line is more certain than the ordinary lower shadow line. A typical example is that after the market has undergone a large decline, the price continues to squat down but rebounds sharply, and a long shadow line is formed.
This situation indicates that the current market may ending the downward trend and enter an upward trend. In general, the probability of the appearance of the long shadow line is low. Once the lower shadow line is longer than the main part k line plus the upper shadow line, it indicates that the market’s strongest expectation of rising is completely shattered, and the probability of the market going up is highly increased. However, when using the long shadow line to judge the market, it is also necessary to have a premise, that is, the market has experienced a large increase before, and accumulated a large increase in energy.
Strategy logic
Based on the K-line theory above, we can try to develop a strategy for long upper and lower shadow lines. Before developing the strategy, let’s figure out the logic of this strategy, as follows:
- Step 1: Calculate the upper shadow line length
UP - Step 2: Calculate the main part k line length
MIDDLE - Step 3: Calculate the lower shadow line length
DOWN - Opening Long position: The length of the lower shadow line is greater than the BN times of the sum of the main part k line plus the upper shadow line
- Opening Short position: The length of the upper shadow line is greater than the BN times of the sum of the main part k line plus the lower shadow line
- Closing Long position: The length of the upper shadow line is greater than the SN times of the main part k line plus the lower shadow line
- Closing Short position: The length of the lower shadow line is greater than the SN times of the main part k line plus the upper shadow line
Note: BN and SN are coefficients, because relatively speaking, futures usually rises slowly and falls sharply, so we give different coefficients when we are buying long or selling short.
Strategy code
Based on the above strategy logic, we can implement it on FMZ Quant platform. Open: fmz.com > Login > Dashboard > Strategy Library > New Strategy > Click on the drop-down menu in the upper right corner to select My language, start writing the strategy, and pay attention to the comments in the code below.
UP: HIGH - IFELSE(ISUP, CLOSE, OPEN);  // upper shadow line
MIDDLE: IFELSE(ISUP, CLOSE, OPEN) - IFELSE(ISUP, OPEN, CLOSE);  // main part k line
DOWN: IFELSE(ISUP, OPEN, CLOSE) - LOW;  // Lower shadow line

DOWN > (MIDDLE + UP) * BN, BK;  // opening long position
UP > (MIDDLE + DOWN) * SN, SP;  // opening short position
UP > (MIDDLE + DOWN) * SN, SK;  // closing long position
DOWN > (MIDDLE + UP) * BN, BP;  // closing short position
AUTOFILTER;
Get the strategy
Click copy strategy source code without configuration, direct online backtest at : https://www.fmz.com/strategy/165130
Conclusion
Simple K line is intuitive, and has a wealth of information. It is the most common basic data and tools in trading. The long upper and lower shadow lines can measure the power changes of buying and selling, and the principle behind it is very simple. The quantification of it is very friendly for beginners. However, the trend of the K-line in actual market is not exactly the same as the theory, which means that we are pursuing a big probability rather than certainty in the trading business.