Summary

What is the most important thing when backtest the trading strategy? the speed? The performance indicators?
The answer is accuracy! The purpose of the backtest is to verify the logic and feasibility of the strategy. This is also the meaning of the backtest itself, the others are secondary. A backtest results that truly reflects the strategy’s historical data has a reference value. Those seemingly perfect backtest curves can tell a nice story, but can’t be done in the real market environment.
What data is needed for backtesting
How to achieve accurate backtesting is a problem that many quantitative traders care about. The first thing we need to figure out is that what data is in the trading, because the quality of the data has largely determined the quality of the backtest.
For these data types, most people may think of the opening price, the highest price, the lowest price, the closing price and the trading volume on the K-line chart. For better distinction, we refer to these data collectively as Bar data, which you can understand it as the K line. But have you ever thought about where the data came from, and where is the source of these data?
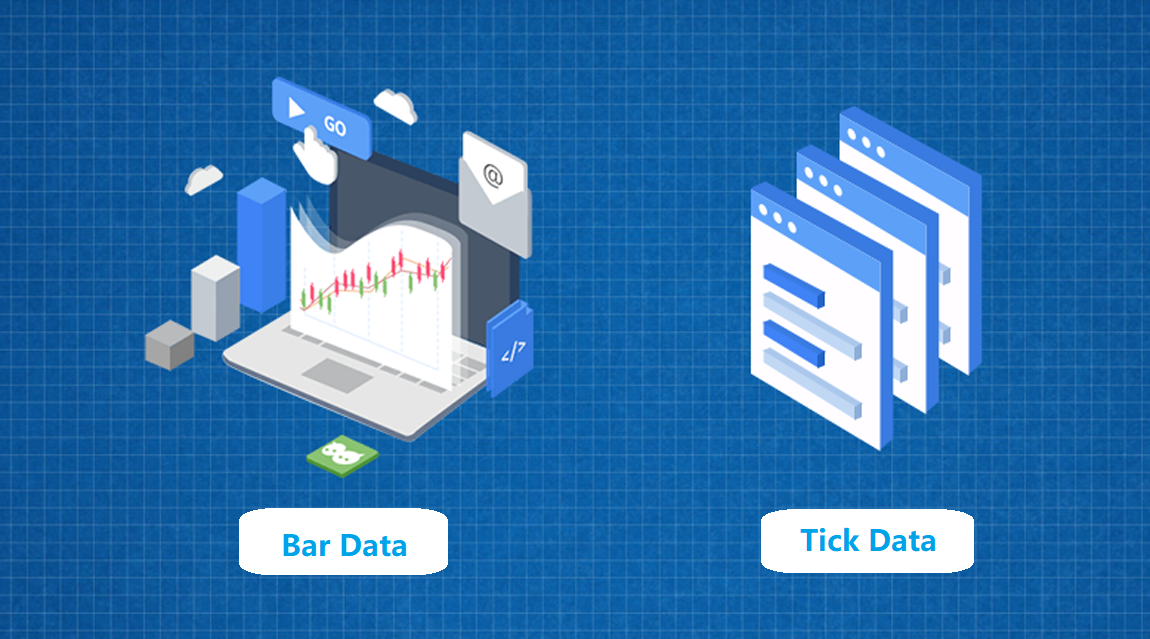
In fact, the data from the exchange sending back does not contain these Bar data, only Tick data. So what is Tick data? You can image the data in the exchange as a river. This river contains detailed data for each order. The Tick data is a slice in the data stream. The frequency is 2 slices per second. it is a reproduction of certain market situation.
Then, the Bar data is based on Tick data and is divided according to the time period. The 1-minute Bar data is composed of Tick data within 1 minute, the 5-minute Bar data is composed of Tick data within 5 minutes, and so on. It formed a variety of minute charts, hourly charts, daily chart and so on. The one-minute K line has only one Bar data, but may contain 120 Tick data. Therefore, the backtest historical data can be divided into: Bar data and Tick data, and the amount of data in Tick data is much larger than the amount of Bar data in the same cycle.
Backtest based on Bar data
Most of quantitative trading software on the market are all supporting the backtesting of Bar data. Because the amount of data is small, the workload of the backtesting engine is greatly simplified. Therefore, this backtesting is usually very fast, and the data of ten years can be backtest within a few seconds. Even when backtest dozens of futures varieties at the same time will not exceed one minute. But Bar data backtesting has a lot of problems:
- Extreme prices
Most traders knows that it is difficult to buy or sell on the daily limit price, but it can be traded in the backtest environment. Some new traders join quantitative trading, if they don’t filter out this situation in the strategy, the results of the backtest will be inconsistent with the real market outcomes.

- The price vacuum
When the price suddenly jump from the lowest limit to the highest limit price or appearing a price gap, it is shown as a big positive K line on the large cycle K-line chart, but there is no transactions be done during the whole time. If you are designing a real-time price trading strategy, The Bar data in the backtest can be traded.
For example: the current K-line has been hovering around the price 5000, and it suddenly rise to 5100 near the market closing, and there are almost no pending orders and transactions in the middle. If your strategy is to open position on this price of 5050, then it can be traded in the Bar data backtest, and this phenomenon is very common.
- Stealing prices and future data
I believe that many quantitative traders have encountered such pits, and most of those 45-degree angle backtest curves are from this. In order to facilitate everyone’s understanding, let me give another example: We know that one K line has 4 prices. If it is a 1 minute positive k line, then the formation of this K line should be: opening price >>> lowest price >>>> highest Price >>> closing price.
However, the large cycle k line will not be so simple. It may reaches a new high, then a new low, and then close; it may also reaches a new low, then a new high, and then close; or even after a round of twists and turns, it reaches a new low, and then the new high, and then the new low, and then close; but it just appears as a K line with upper and lower shadow, there are many possibilities in the middle of how it formed.
If a K line is appearing like this: opening price 4950, lowest price 4900, highest price 5100, closing price 5050, a normal positive K line. Your strategy is: If the latest price exceeds the previous highest price 5000, buy long, and set a stop loss of 1% after opening position, that is, when the price fall below 4950, it will preform stop loss.
ok, let’s start the backtest:
Opening price 4950
The price exceeds the previous high 5000
Opening long position
Earned 1% when the market closed
but the real situation could be like this:
Opening price 4950
The price exceeds the previous high 5000
Opening long position
Soon the price begins to fall
Continue to fall to 4949
Stop loss signal triggers stop loss 1%
Price rises to 5100
Market close at 5050
As you can see, the above example, the same strategy, the same data, there were two very different results. The reason is still because of the difference in data. In the Bar level backtest, if you use the daily K-line backtest, you wouldn’t know how these K lines are formed. If you use the hourly K-line backtest, you wouldn’t know these hourly k line are formed. In short, Bar data test are weak!
- Backtest based on Tick data
If you can use Tick data for backtesting and analysis, there is no doubt that it has great advantages. However, there seems to be no quantitative trading platform for Tick data backtesting and analysis on the market. For example, MT4 uses interpolation simulation data. This just simulates changes in the data, not real Tick data.
Of course, there are softwares that claim to be able to do Tick-level backtesting. but these software made a fatal mistake when designing the backtesting engine, that is: “price matching mechanism”. What does it mean? If the current Tick data are: selling price 5001, buying price 5000, if my pending buying order is at 5000, in the real market, it definitely not able going to trade, but the truth is not.
Be aware that in a real trading environment, the orders we placed are matched in the exchange’s Tick data stream. The exchange’s matching rules are: price priority, time priority. If the order depth are not too thick at this time, the 5000 price buying order that we sent are likely to be passively traded.
- The principle of backtesting engine based on market data
Therefore, the FMZ Quant platform (fmz.com) Tick-level backtesting engine came into being, this backtesting engine not only match the orders based on the price priority of the Tick data. According to the same price priority, the number of pending orders is calculated to determine whether the current pending order has reached the condition of passive transaction, so as to achieve a real simulation environment. Let us take the following as an example:
- The first Tick is:
Sell: 101 Volume: 80
Buy: 100 Volume: 30 - The second Tick is:
Sell: 101 Volume: 60
Buy: 100 Volume: 50 - The third Tick is:
Sell: 101 Volume: 80
Buy: 100 Volume: 30 - The 4th Tick is:
Sell: 101 Volume: 80
Buy: 100 Volume: 10
For the first Tick, the buying price is 100, the amount of pending orders is 30 lots; at this time, the buying signal comes, buy 20 lots at 100 price; the second Tick is generated, the buying price is 100, and the pending order quantity is 50. there are 20 lots of pending orders; the third Tick is produced, the buying price is 100, and the amount of pending orders is 30 lots. This proves that 20 lots have been executed or cancelled, and we are closing to the deal; the fourth Tick was produced, the buying price was 100, and the amount of pending orders was 10 lots. It was a big seller, and all of our buying orders executed at once.
Through the above example, we can find that in the Tick data, under the premise that the price has not changed, it is possible to calculate whether there is a passive transaction of the pending order through the change of the amount of the pending order. The use of the same price, time-first approach. This kind of backtesting engine almost bionics the real trading environment, eliminating the “price matching mechanism” of the transaction and the false transaction, so that each market data is truly shown, so that the backtest is the same as the real market, only such backtest makes sense.
Which way to backtest?
On FMZ Quant platform, Bar and Tick level backtesting exist at the same time. Each quantitative trader can use different backtesting engines according to their own trading strategies, and no matter which kind of backtesting you use. The engine does not need to modify the strategy code, and each type of backtesting can be seamlessly switched.
low frequency strategy backtesting does not require a complex matching engine, because the number of transaction for such strategies are small, the cost of slippage does not have a big impact on the strategy itself. In general, only a few slippage points need to be added during the backtesting, use the Bar-level backtesting will be enough. What really needs attention is the problem of overfitting.
Some intraday trading or strategies involving opening position during the day, if necessary, can also adjust the data granularity on the backtesting configuration parameters page, such as backtesting on a 1-hour cycle, which can be adjusted to finer 15-minute data. It can also use Tick level data when necessary to improve the accuracy of backtesting.
High-frequency trading because the number of transaction is high enough, a single variety can trade dozens or even hundreds of times in a day, so as long as the matching engine is reasonable, then under the effect of the law of “large numbers”, the results of the backtesting are basically reliable. There is generally no problem with overfitting. However, due to the high number of high frequency transactions, there is a very high demand for the backtest engine.
In the high-frequency trading backtest, the higher of transaction frequency, the shorter time period of holding position; the lower of average profit of a single transaction. At this time, if the design of the backtest engine is unreasonable, or the matching orders method compare with the real trading environment are not the same, then there will be a phenomenon of “a little difference makes a huge thousand disparity”, so for high-frequency trading, the backtest engine at the Tick level is the best choice.
Tick level data backtest according to the real market data
We demonstrate to you how a Tick-level backtest works with a high-frequency market making strategy written in C++ (which also supports Python and JavaScript). You can complete the strategy and perform online backtesting by clicking on the link below. The following picture is taken from the log information. Note that we bought 1 lot at the price of 2231 at 2019-07-12 14:59, and sell it at 2232.
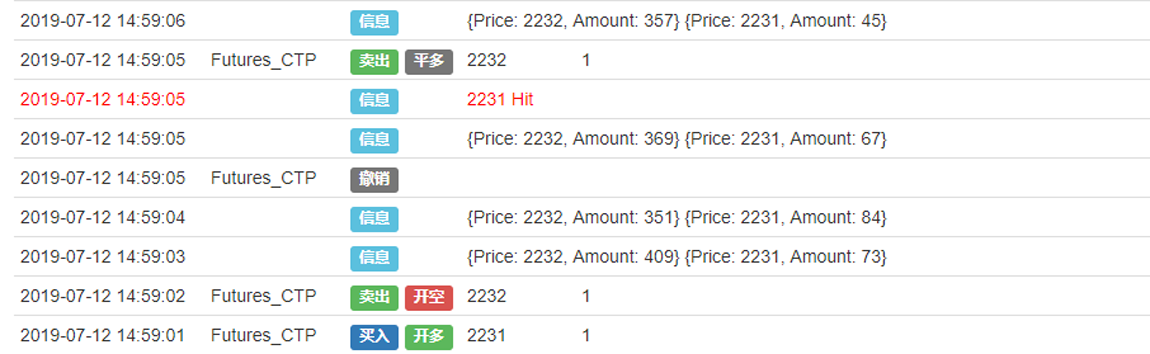
- The first Tick is:
Sell: 2232 Volume: 409
Buy: 2231 Volume: 73 - The second Tick is:
Sell: 2232 Volume: 351
Buy: 2231 Volume: 84 - The third Tick is:
Sell: 2232 Volume: 369
Buy: 2231 Volume: 67
This demonstration strategy is to close the position when making a price ticking profit. After opening the position, we send the closing position order at 2232 to close long position, and 2231 to close short position. According to the traditional Bar level backtest, the price of this pending order cannot be closed. However, the platform’s Tick-level backtesting engine constantly calculates the change in the amount of orders on the market. When the third Tick data is generated, according to the exchange order marching mechanism of the exchange, if the price is the same, according to the time-first rule, our closing long position operation will be traded.
Copy strategy
Click this link (https://www.fmz.com/strategy/162372) to copy the complete strategy without having to configure parameters
Note: At present, we only support the full range of chinese domestic commodity futures and the Tick level data of the cryptocurrency OKEX exchange. We will support more exchanges in the future.
End
The above is the FMZ Quant platform analysis and actual combat of the all-level backtesting. Not only that, but in addition to supporting professional traders and institutional users, it is also very friendly to novices who have not yet started. Visual language can be implemented without writing code. In addition, the My language can be settled in 10 sentences.
Thinking about strategy, doing statistics, and analyzing… The trading has been very hard. Whether you are a low frequency CTA, intraday trading, high frequency trading, the FMZ Quant quantitative trading platform can be perfectly seamlessly supported. We do not make toy functions, based on accurate historical backtesting at the Tick level, we can test any combination of multiple varieties, multiple strategies and multiple cycles to help you build an optimal investment portfolio.