Summary
As the saying goes, This world will seperate after long time united. Also will do the opposite after long time pliting. And this phenomenon also exists in the futures market. There is no variety that only rises but does not fall. But when to rise and when to fall, it depends on the deviation rate. In this article, we will use the deviation rate to construct a simple trading strategy.
Brief introduction
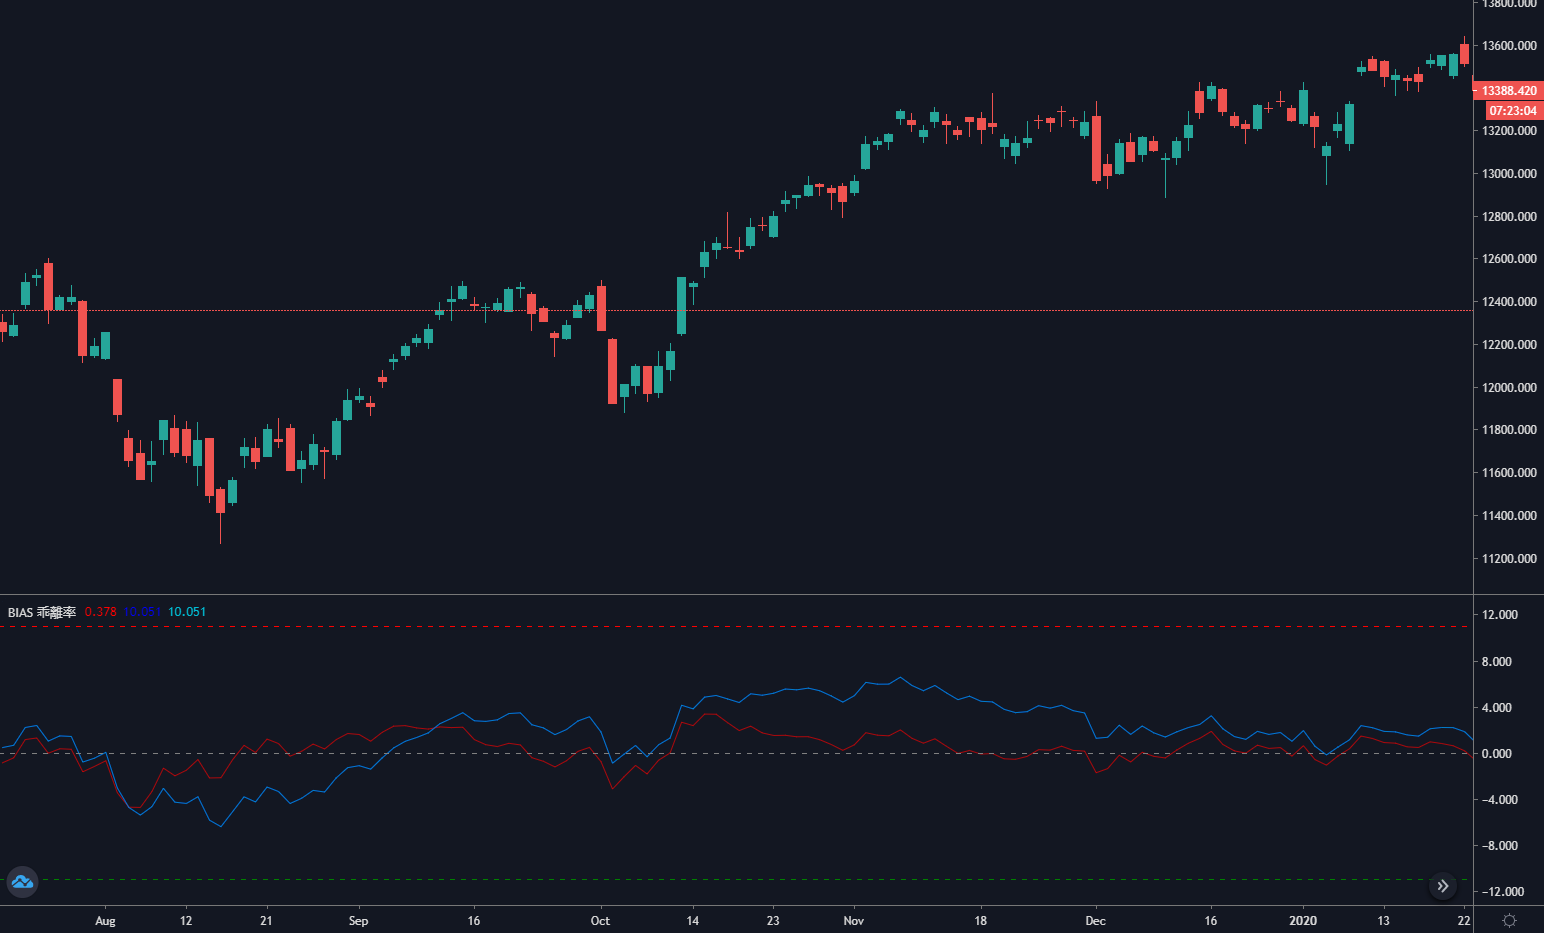
Deviation rate BIAS is a technical indicator derived from the moving average. It is mainly in the form of a percentage to measure the degree of price deviation from the moving average in fluctuations. If the moving average is the average cost of a trader, the deviation rate is the average rate of return of the trader.
The principle of deviation rate
The theoretical basis of the deviation rate is an analysis of the trader’s heart. When the price is greater than the average cost of the market, it means that the long position traders will have the idea of cash out the profits, which will cause the price to fall. When the price is less than the average cost of the market, it means that short-sellers are profitable, and the idea of cash out the profit will cause the price to rise.
- When the price deviates upward from the moving average, the deviation rate is too large, and there is a high probability that the price will fall in the future.
- When the price deviates from the moving average downward, the deviation rate is too small, and there is a high probability that the price will rise in the future.
Although the moving average is calculated from the price, in terms of external form, the price will definitely move closer to the moving average, or the price will always fluctuate around the moving average. If the price deviates too far from the moving average, regardless of whether the price is above or below the moving average, it may eventually tend to the moving average, and the deviation rate is the percentage value that the price deviates from the moving average.
Formula for calculating deviation rate
Deviation rate = [(the closing price of the day – N day average price) / N day average price] * 100%
Among them, N is the moving average parameter, because the period of N is different, the calculation result of the deviation rate is also different. In general, the values of N are: 6, 12, 24, 36, etc. In actual use, it can also be dynamically adjusted according to different varieties. However, the selection of parameters is very important. If the parameter is too small, the deviation rate will be too sensitive, if the parameter is too large, the deviation rate will be too slow. The calculation results of the deviation rate are positive and negative. The greater the positive deviation rate, the greater the profit of the bulls and the greater the probability of price correction. The greater the negative deviation rate, the greater the short profit and the greater the probability of price rebound.
Strategy logic
Since the deviation rate is another form of moving average, then we can also adapt a double deviation rate strategy based on the double moving average strategy. Judging from the positional relationship between the short-term deviation rate and the long-term deviation rate, the current market state is judged. If the long-term deviation rate is greater than the short-term deviation rate, it actually represents the short-term moving average up cross the long-term moving average, and vice versa.
- Long position opening: if there is no current holding position and the long-term deviation rate is greater than the short-term deviation rate
- Short position opening: if there is no current holding position and the long-term deviation rate is less than the short-term deviation rate
- Long position closing: if there is a holding long position, and the long-term deviation rate is less than the short-term deviation rate
- Short position closing: if there is a holding short position, and the long-term deviation rate is greater than the short-term deviation rate
Strategy writing
Step 1: Write a strategy framework
# Strategy main function
def onTick():
     pass


# Program entry
def main():
     while True: # Enter infinite loop mode
         onTick() # execution strategy main function
         Sleep(1000) # sleep for 1 second
FMZ platform adopts the rotation training mode. First, a main function and an onTick function need to be defined. The main function is the entry function of the strategy, and the program will execute the code line by line starting from the main function. In the main function, write a while loop and repeatedly execute the onTick function. All the core code of the strategy is written in the onTick function.
Step 2: Define virtual positions
mp = 0
The advantage of virtual positions is that it is simple to write, and iterative operation is fast. It is generally used in the backtest environment. It is assumed that every order is completely filled, but the actual position is usually used in actual trading. Since the virtual position is to record the state after opening and closing, it needs to be defined as a global variable.
Step 3: Get K line
exchange.SetContractType('rb000') # Subscribe to futures varieties
bars_arr = exchange.GetRecords() # Get K-line array
if len(bars_arr) <long + 1: # If the number of K lines is too small
     return
Using the FMZ function SetContractType, you can subscribe to the rebar index contract by passing in “rb000”, but in the backtest and real market situation, the rebar index is used as the data, and the specific main contract is used to place the order. Then use the GetRecords function to get the K-line data of the rebar index. Since it takes a certain period to calculate the deviation rate, in order to avoid program errors, if there are not enough K lines, use if statements to filter.
Step 4: Calculate the deviation rate
close = bars_arr[-2]['Close'] # Get the closing price of the previous K line
ma1 = TA.MA(bars_arr, short)[-2] # Calculate the short-term moving average value of the previous K line
bias1 = (close-ma1) / ma1 * 100 # Calculate the short-term deviation rate value
ma2 = TA.MA(bars_arr, long)[-2] # Calculate the long-term average of the previous K line
bias2 = (close-ma2) / ma2 * 100 # Calculate the long-term deviation rate value
According to the formula for calculating the deviation rate, we first obtain the closing price. In this strategy, we use the previous K-line closing price, which means that the current K-line signal is established and the next K-line is for placing orders. Then use the FMZ built-in talib library to calculate the moving average. For example, the moving average is: TA.MA. This function receives 2 parameters, namely: K line array and moving average period.
Step 5: Placing orders
global mp # global variables
current_price = bars_arr[-1]['Close'] # latest price
if mp> 0: # If you are holding long positions
    if bias2 <= bias1: # If the long-term deviation rate is less than or equal to the short-term deviation rate
        exchange.SetDirection("closebuy") # Set the trading direction and type
        exchange.Sell(current_price-1, 1) # Closing long positions
        mp = 0 # reset virtual holding positions
if mp <0: # If you are holding short positions
    if bias2 >= bias1: # If the long-term deviation rate is greater than or equal to the short-term deviation rate
        exchange.SetDirection("closesell") # Set the trading direction and type
        exchange.Buy(current_price + 1, 1) # closing short positions
        mp = 0 # reset virtual holding positions
if mp == 0: # If there is no holding position
    if bias2> bias1: # Long-term deviation rate is greater than short-term deviation rate
        exchange.SetDirection("buy") # Set the trading direction and type
        exchange.Buy(current_price + 1, 1) # open long positions
        mp = 1 # reset virtual holding position
    if bias2 <bias1: # The long-term deviation rate is less than the short-term deviation rate
        exchange.SetDirection("sell") # Set the trading direction and type
        exchange.Sell(current_price-1, 1) # open short positions
        mp = -1 # reset virtual holding position
Complete strategy
# Backtest configuration
'''backtest
start: 2018-01-01 00:00:00
end: 2020-01-01 00:00:00
period: 1h
basePeriod: 1h
exchanges: [{"eid":"Futures_CTP","currency":"FUTURES"}]
'''

# External parameters
short = 10
long = 50


# Global variables
mp = 0


# Strategy main function
def onTick():
    # retrieve data
    exchange.SetContractType('rb000') # Subscribe to futures varieties
    bars_arr = exchange.GetRecords() # Get K-line array
    if len(bars_arr) <long + 1: # If the number of K lines is too small
        return

    # Calculate BIAS
    close = bars_arr[-2]['Close'] # Get the closing price of the previous K line
    ma1 = TA.MA(bars_arr, short)[-2] # Calculate the short-term moving average of the previous K line
    bias1 = (close-ma1) / ma1 * 100 # Calculate the short-term deviation rate value
    ma2 = TA.MA(bars_arr, long)[-2] # Calculate the long-term average of the previous K line
    bias2 = (close-ma2) / ma2 * 100 # Calculate the long-term deviation rate value

    # Placing Orders
    global mp # global variables
    current_price = bars_arr[-1]['Close'] # latest price
    if mp> 0: # If you are holding long positions
        if bias2 <= bias1: # If the long-term deviation rate is less than or equal to the short-term deviation rate
            exchange.SetDirection("closebuy") # Set the trading direction and type
            exchange.Sell(current_price-1, 1) # closing long positions
            mp = 0 # reset virtual holding position
    if mp <0: # If you are holding short positions
        if bias2 >= bias1: # If the long-term deviation rate is greater than or equal to the short-term deviation rate
            exchange.SetDirection("closesell") # Set the trading direction and type
            exchange.Buy(current_price + 1, 1) # closing short positions
            mp = 0 # reset virtual holding position
    if mp == 0: # If there is no holding position
        if bias2> bias1: # Long-term deviation rate is greater than short-term deviation rate
            exchange.SetDirection("buy") # Set the trading direction and type
            exchange.Buy(current_price + 1, 1) # opening long positions
            mp = 1 # reset virtual holding position
        if bias2 <bias1: # The long-term deviation rate is less than the short-term deviation rate
            exchange.SetDirection("sell") # Set the trading direction and type
            exchange.Sell(current_price-1, 1) # open short positions
            mp = -1 # reset virtual holding position


# Program entry function
def main():
    while True: # loop
        onTick() # execution strategy main function
        Sleep(1000) # sleep for 1 second
The complete strategy has been published on the FMZ website:
https://www.fmz.com/strategy/215129
Strategy backtest
Backtest configuration
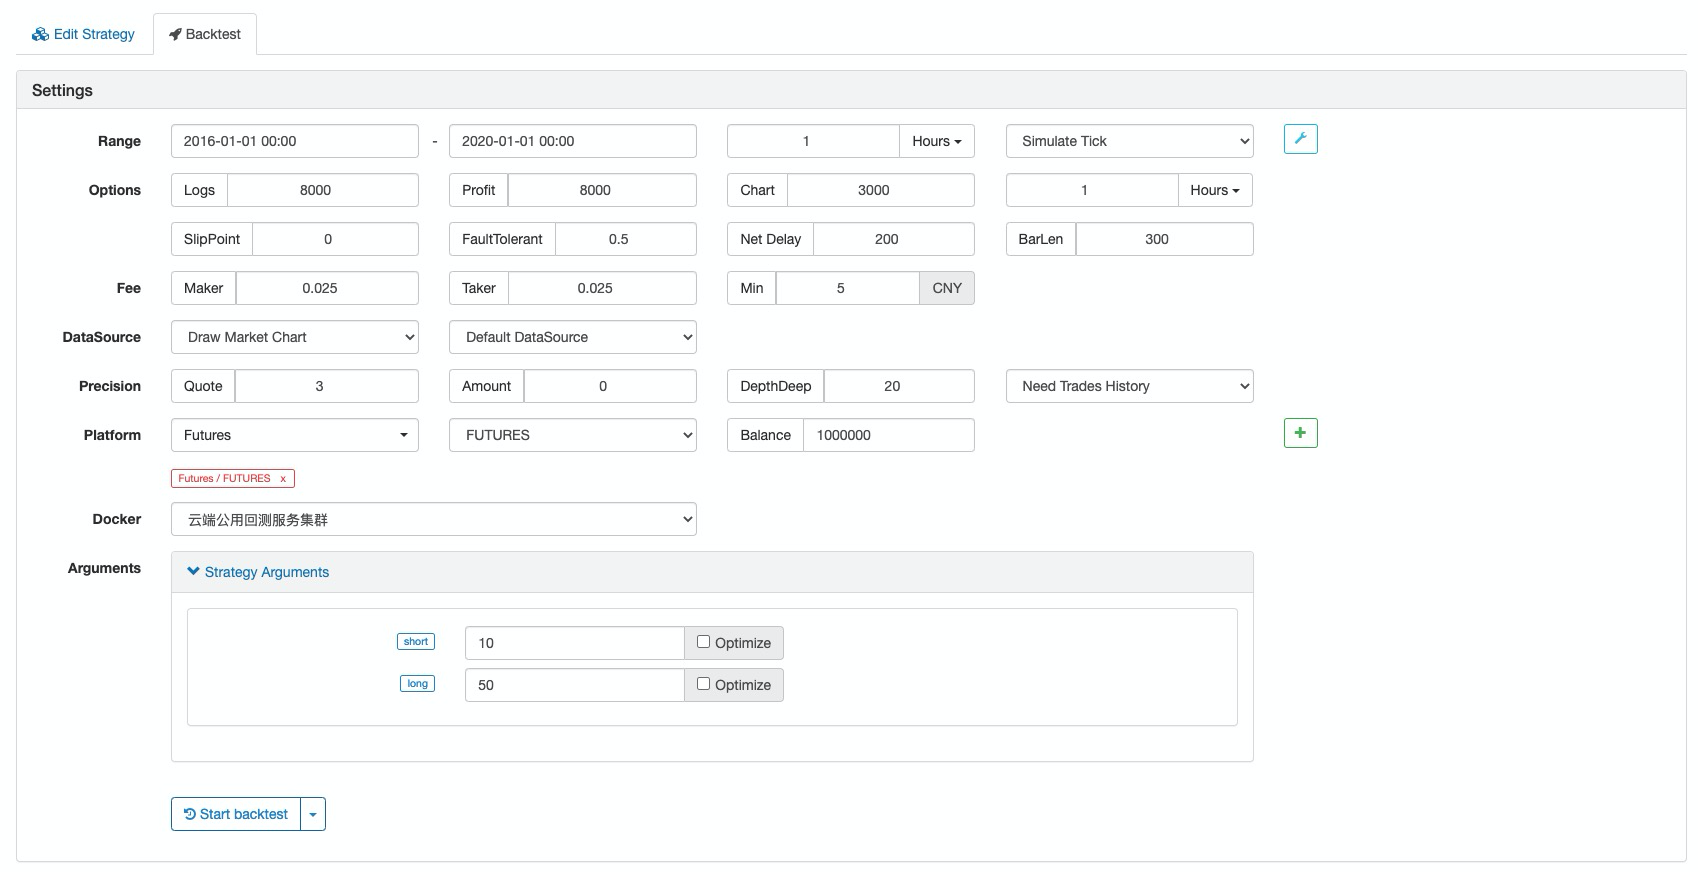
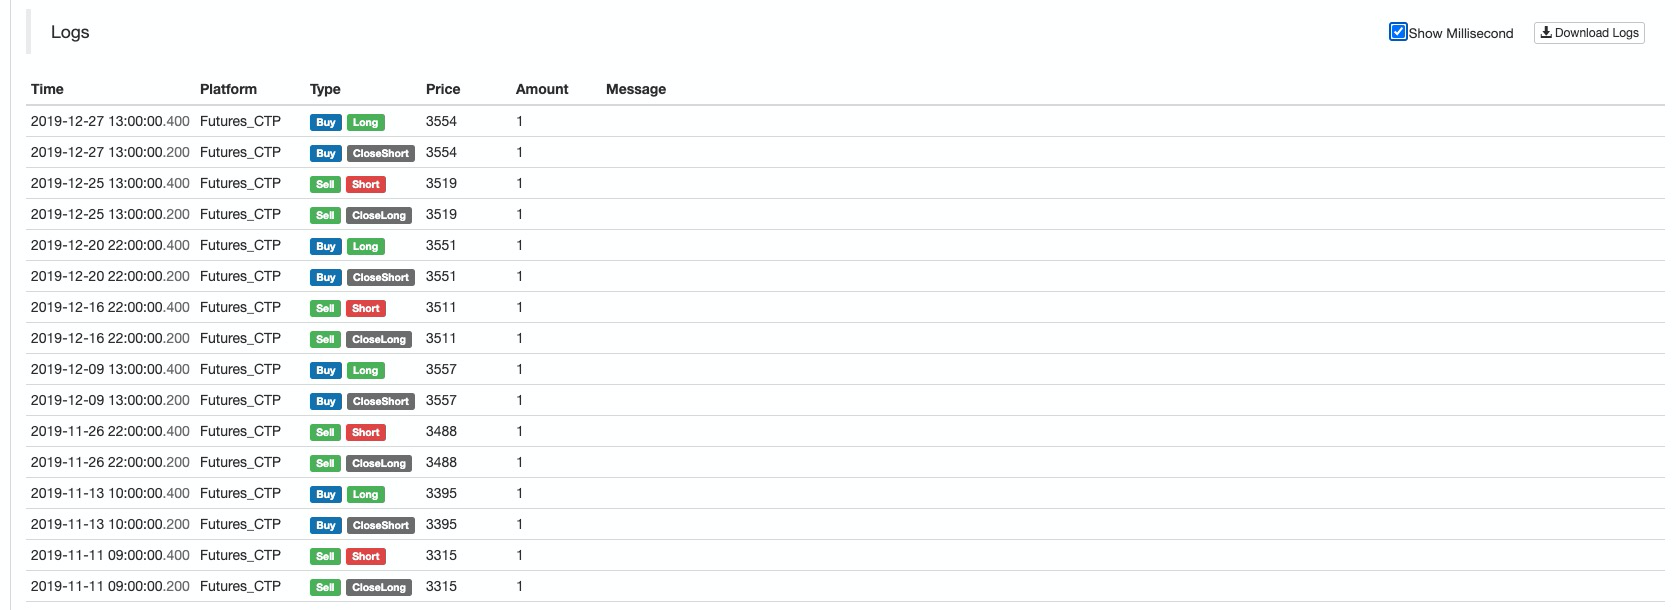
Performance report

Fund curve
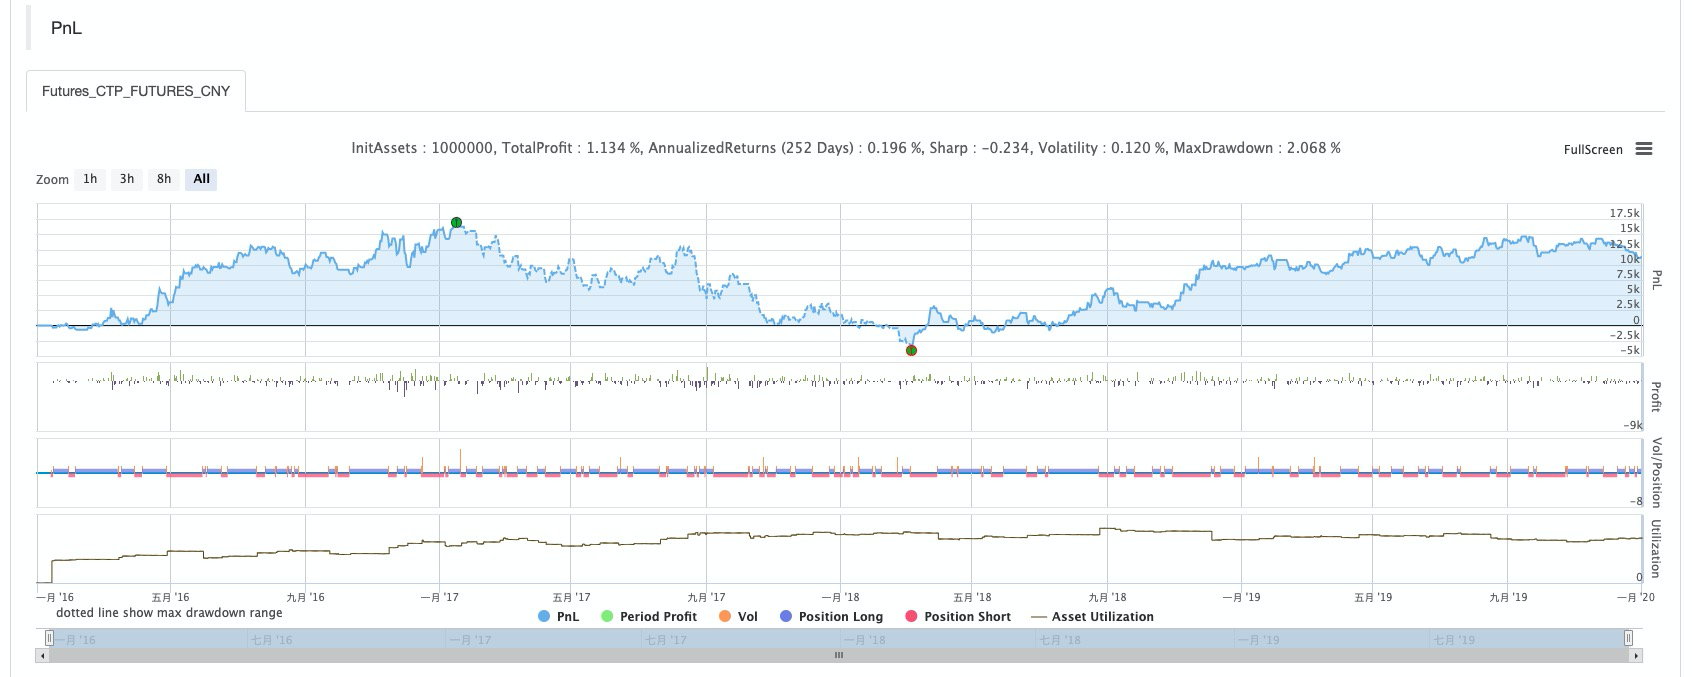
To Sum Up
Deviation rate is a simple and effective trading tool that can provide an effective reference for traders. In actual use, it can be flexibly applied with MACD and Bollinger band indicators to truly reflect its value.


