
2021 Conclusion and Future Strategy.ipynb
2021 is coming to an end, and hot spots from DEFI to GAMEFI are emerging one after another, and the overall market is still in a bull market. Looking back now, how much have you earned in 2021? What opportunity was missed? Are there any successful investments? Recently, I pulled the history market quotes of the past year and found an unexpectedly simple profiteering strategy, but it is a multi-currency index.
There are too many currency symbols listed in platforms, and many are destined to be unknown and may even be withdrawn from trading. Here we choose the currency symbols that have been listed on Binance Perpetual Swap. They have generally been tested and are recognized as mainstream currencies, which are relatively safe. After a simple screening, some index currencies were removed, and 134 currencies finally survived.
import requests
from datetime import date,datetime
import time
import pandas as pd
import numpy as np
import matplotlib.pyplot as plt
%matplotlib inline
##current trading pair
Info = requests.get('<a rel="noreferrer noopener" href="https://fapi.binance.com/fapi/v1/exchangeInfo" target="_blank">https://fapi.binance.com/fapi/v1/exchangeInfo</a>')
symbols = [s['symbol'] for s in Info.json()['symbols']]
symbols_f = list(set(filter(lambda x: x[-4:] == 'USDT', [s.split('_')[0] for s in symbols]))-
set(['1000SHIBUSDT','1000XECUSDT','BTCDOMUSDT','DEFIUSDT','BTCSTUSDT'])) + ['SHIBUSDT','XECUSDT']
print(symbols_f)
print(len(symbols_f))
Market in the Past Year
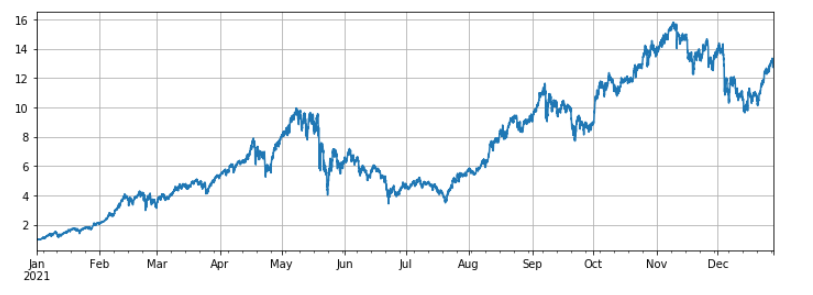
Then, we get their daily close prices in the past year, and we notice that some currency symbols were only on the market for a short period of time, so the data needs unitization processing. By unitizing the data, the index can be calculated.
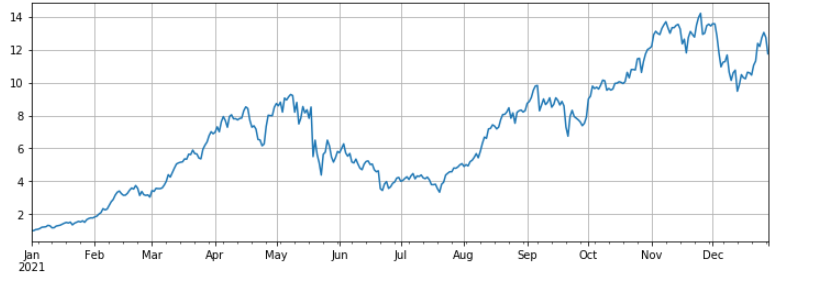
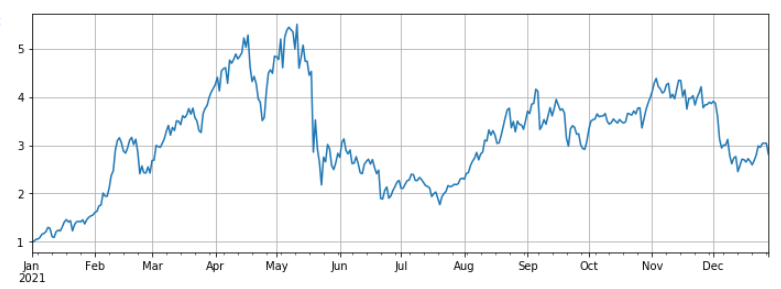
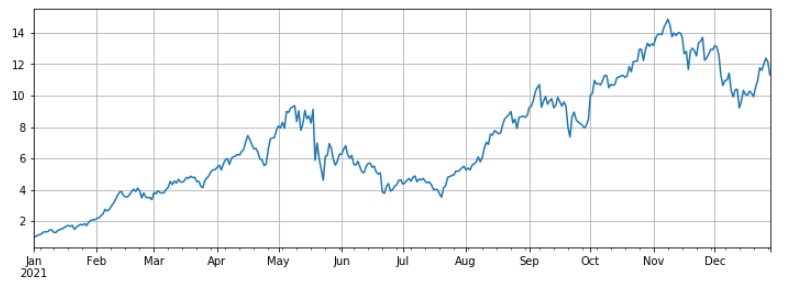
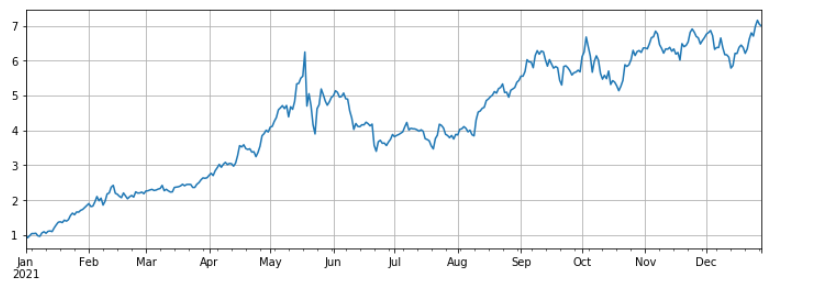
The final index profit is about 12 times, that is to say, if you buy these 134 currency symbols on average on January 1, 2021, the final profit of doing nothing is 12 times, and it is estimated that more than 90% of people do not outperform the average index. Among them, the currency symbols with the largest decline: ICP fell by 93%, DODO fell by 85%, and LINA fell by 75%. The increase of nearly a hundred times: SOL, FTM, LUNA, MATIC, SAND, AXS. Among them, AXS has increased by 168 times and is the biggest dark horse. The median increased 3 times. It can be said that the index is mainly driven by the public chains and games. In order to prevent survivorship bias, excluding the newly listed currency symbols during the period, it also achieved a profit of nearly 11 times. It is 7 times the profit of simply holding BTC.
This is a desperate profit ratio. I have worked hard and tried all kinds of strategies, and I have not made as much profit as a year when I did not make any extra efforts. However, it should be noted that several of the ratio increases are too huge, and obviously deviate from the index. If these currency symbols are not selected at the beginning of the year, the profit will be close to the median, which is far less prominent.
#function to obtain K-line in any period
def GetKlines(symbol='BTCUSDT',start='2020-8-10',end='2021-8-10',period='1h',base='fapi',v = 'v1'):
Klines = []
start_time = int(time.mktime(datetime.strptime(start, "%Y-%m-%d").timetuple()))1000 + 860601000
end_time = int(time.mktime(datetime.strptime(end, "%Y-%m-%d").timetuple()))1000 + 860601000
intervel_map = {'m':601000,'h':60601000,'d':2460601000}
while start_time < end_time:
mid_time = min(start_time+1000*int(period[:-1])intervel_map[period[-1]],end_time)
url = 'https://'+base+'.binance.com/'+base+'/'+v+'/klines?symbol=%s&interval=%s&startTime=%s&endTime=%s&limit=1000'%(symbol,period,start_time,mid_time)
res = requests.get(url)
res_list = res.json()
if type(res_list) == list and len(res_list) > 0:
start_time = res_list[-1][0]
Klines += res_list
elif type(res_list) == list:
start_time = start_time+1000int(period[:-1])*intervel_map[period[-1]]
else:
break
df = pd.DataFrame(Klines,columns=['time','open','high','low','close','amount','end_time','volume','count','buy_amount','buy_volume','null']).astype('float')
df.index = pd.to_datetime(df.time,unit='ms')
profit df
df_all_s = pd.DataFrame(index=pd.date_range(start='2021-1-1', end='2021-12-28', freq='1d'),columns=symbols_s)
for i in range(len(symbols_f)):
#print(symbols_s[i])
symbol_s = symbols_f[i]
df_s = GetKlines(symbol=symbol_s,start='2021-1-1',end='2021-12-28',period='1d',base='api',v='v3')
df_all_s[symbol_s] = df_s[~df_s.index.duplicated(keep='first')].close
df_all_s.tail() #data structure
df_all = df_all_s.fillna(method='bfill')#fill data
df_norm = df_all/df_all.iloc[0] #unitization
df_norm.mean(axis=1).plot(figsize=(12,4),grid=True);
#chart of final index profit
#median increase
df_norm.median(axis=1).plot(figsize=(12,4),grid=True);
#rise and fall sorting<br>print(df_norm.iloc[-1].round(2).sort_values().to_dict())
#maximum withdraw of the current price compared to the highest price in the past year<br>print((1-df_norm.iloc[-1]/df_norm.max()).round(2).sort_values().to_dict())
df_all_f = pd.DataFrame(index=pd.date_range(start='2021-1-1', end='2021-12-28', freq='1d'),columns=symbols_s)<br>for i in range(len(symbols_f)):<br>#print(symbols_s[i])<br>symbol_f = symbols_f[i]<br>df_f = GetKlines(symbol=symbol_f,start='2021-1-1',end='2021-12-28',period='1d',base='fapi',v='v1')<br>df_all_f[symbol_f] = df_f[~df_f.index.duplicated(keep='first')].close
#not includde new symbols<br>df = df_all_s[df_all_s.columns[~df_all_f.iloc[0].isnull()]]<br>df = df.fillna(method='bfill')<br>df = df/df.iloc[0]<br>df.mean(axis=1).plot(figsize=(12,4),grid=True);
#compared to BTC<br>(df.mean(axis=1)/df.BTCUSDT).plot(figsize=(12,4),grid=True);
#use the old backtest engine
class Exchange:

def __init__(self, trade_symbols, fee=0.0004, initial_balance=10000):
    self.initial_balance = initial_balance #initial asset
    self.fee = fee
    self.trade_symbols = trade_symbols
    self.account = {'USDT':{'realised_profit':0, 'unrealised_profit':0, 'total':initial_balance, 'fee':0}}
    for symbol in trade_symbols:
        self.account[symbol] = {'amount':0, 'hold_price':0, 'value':0, 'price':0, 'realised_profit':0,'unrealised_profit':0,'fee':0}

def Trade(self, symbol, direction, price, amount):

    cover_amount = 0 if direction*self.account[symbol]['amount'] >=0 else min(abs(self.account[symbol]['amount']), amount)
    open_amount = amount - cover_amount
    self.account['USDT']['realised_profit'] -= price*amount*self.fee #deduct service fee
    self.account['USDT']['fee'] += price*amount*self.fee
    self.account[symbol]['fee'] += price*amount*self.fee

    if cover_amount > 0: #close first
        self.account['USDT']['realised_profit'] += -direction*(price - self.account[symbol]['hold_price'])*cover_amount  #profit
        self.account[symbol]['realised_profit'] += -direction*(price - self.account[symbol]['hold_price'])*cover_amount

        self.account[symbol]['amount'] -= -direction*cover_amount
        self.account[symbol]['hold_price'] = 0 if self.account[symbol]['amount'] == 0 else self.account[symbol]['hold_price']

    if open_amount > 0:
        total_cost = self.account[symbol]['hold_price']*direction*self.account[symbol]['amount'] + price*open_amount
        total_amount = direction*self.account[symbol]['amount']+open_amount

        self.account[symbol]['hold_price'] = total_cost/total_amount
        self.account[symbol]['amount'] += direction*open_amount


def Buy(self, symbol, price, amount):
    self.Trade(symbol, 1, price, amount)

def Sell(self, symbol, price, amount):
    self.Trade(symbol, -1, price, amount)

def Update(self, close_price): #update asset
    self.account['USDT']['unrealised_profit'] = 0
    for symbol in self.trade_symbols:
        self.account[symbol]['unrealised_profit'] = (close_price[symbol] - self.account[symbol]['hold_price'])*self.account[symbol]['amount']
        self.account[symbol]['price'] = close_price[symbol]
        self.account[symbol]['value'] = abs(self.account[symbol]['amount'])*close_price[symbol]
        self.account['USDT']['unrealised_profit'] += self.account[symbol]['unrealised_profit']
    self.account['USDT']['total'] = round(self.account['USDT']['realised_profit'] + self.initial_balance + self.account['USDT']['unrealised_profit'],6)
#for more accurate backtest, crawl 1-hour k-line
df_all_s = pd.DataFrame(index=pd.date_range(start='2021-1-1', end='2021-12-28', freq='1h'),columns=symbols_s)
for i in range(len(symbols_f)):
#print(symbols_s[i])
symbol_s = symbols_f[i]
df_s = GetKlines(symbol=symbol_s,start='2021-1-1',end='2021-12-28',period='1h',base='api',v='v3')
df_all_s[symbol_s] = df_s[~df_s.index.duplicated(keep='first')].close
df = df_all_s[df_all_s.columns[~df_all_f.iloc[0].isnull()]]
df = df.fillna(method='bfill')
df = df/df.iloc[0]
df.mean(axis=1).plot(figsize=(12,4),grid=True);
Balanced Strategy Performance
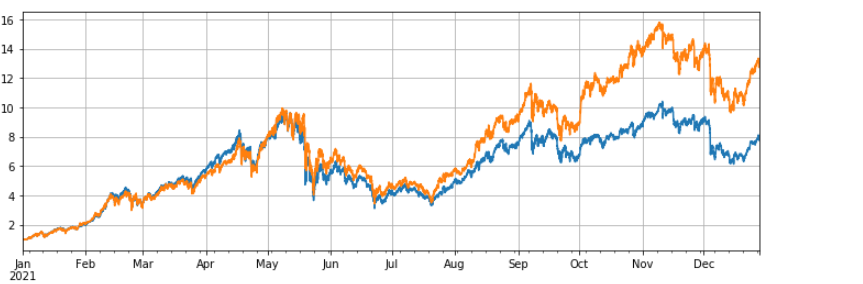
The backtest selected all the currency symbols listed on Binance Perpetual contracts on January 1, 2021. The K-line period is 1h, and the parameter is that start to buy when position amount is less than 5% of the average and start to sell when over 5%. When the backtest is of all currency symbols, the final strategy profit is 7.7 times. Significantly worse than the average profit of 13 times. That is also in my expectation. After all, those currency symbols that increased by a hundred times are too special, and the balanced strategy will sell them all.
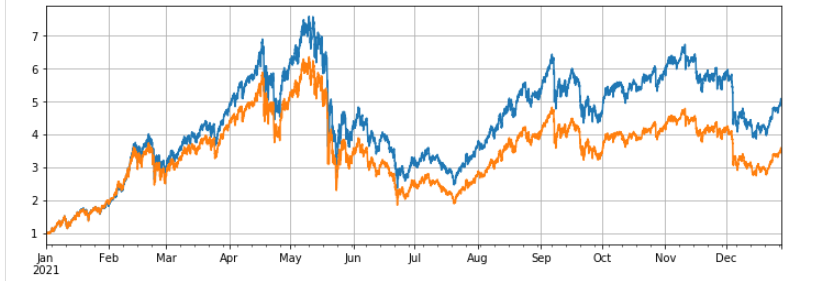
If the backtest chooses to remove the 10 currency symbols with the highest increase, and only examine the relatively mediocre currency symbols, the final profit is 4.8 times, far exceeding the average performance of 3.4 times.
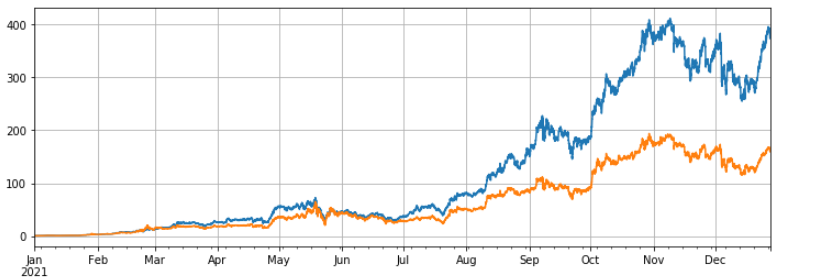
If only the 3 currency symbols with the highest increase are rotated, the final profit is 373 times, far exceeding the average performance of 160 times. It shows that if the trend and increase of the selected rotated currency symbol tend to be consistent, the result of the rotation will be much better than the non-rotation.
#backtest of all symbols
symbols = list(df.iloc[-1].sort_values()[:].index)
e = Exchange(symbols, fee=0.001, initial_balance=10000)
res_list = []
avg_pct = 1/len(symbols)
for row in df[symbols].iterrows():
prices = row[1]
total = e.account['USDT']['total']
e.Update(prices)
for symbol in symbols:
pct = e.account[symbol]['value']/total
if pct < 0.95*avg_pct:
e.Buy(symbol,prices[symbol],(avg_pct-pct)total/prices[symbol])
if pct > 1.05avg_pct:
e.Sell(symbol,prices[symbol],(pct-avg_pct)*total/prices[symbol])
res_list.append([e.account[symbol]['value'] for symbol in symbols] + [e.account['USDT']['total']])
res = pd.DataFrame(data=res_list, columns=symbols+['total'],index = df.index)
e.account['USDT']
#backtest performance of all symbols
(res.total/10000).plot(figsize=(12,4),grid = True);
df[symbols].mean(axis=1).plot(figsize=(12,4),grid=True);
#reduce symbols with huge increase
symbols = list(df.iloc[-1].sort_values()[:-10].index)
e = Exchange(symbols, fee=0.001, initial_balance=10000)
res_list = []
avg_pct = 1/len(symbols)
for row in df[symbols].iterrows():
prices = row[1]
total = e.account['USDT']['total']
e.Update(prices)
for symbol in symbols:
pct = e.account[symbol]['value']/total
if pct < 0.95*avg_pct:
e.Buy(symbol,prices[symbol],(avg_pct-pct)total/prices[symbol])
if pct > 1.05avg_pct:
e.Sell(symbol,prices[symbol],(pct-avg_pct)*total/prices[symbol])
res_list.append([e.account[symbol]['value'] for symbol in symbols] + [e.account['USDT']['total']])
res = pd.DataFrame(data=res_list, columns=symbols+['total'],index = df.index)
e.account['USDT']
(res.total/10000).plot(figsize=(12,4),grid = True);
df[symbols].mean(axis=1).plot(figsize=(12,4),grid=True);
#only test the symbols with the highest increase
symbols = list(df.iloc[-1].sort_values()[-3:].index)
e = Exchange(symbols, fee=0.001, initial_balance=10000)
res_list = []
avg_pct = 1/len(symbols)
for row in df[symbols].iterrows():
prices = row[1]
total = e.account['USDT']['total']
e.Update(prices)
for symbol in symbols:
pct = e.account[symbol]['value']/total
if pct < 0.95*avg_pct:
e.Buy(symbol,prices[symbol],(avg_pct-pct)total/prices[symbol])
if pct > 1.05avg_pct:
e.Sell(symbol,prices[symbol],(pct-avg_pct)*total/prices[symbol])
res_list.append([e.account[symbol]['value'] for symbol in symbols] + [e.account['USDT']['total']])
res = pd.DataFrame(data=res_list, columns=symbols+['total'],index = df.index)
e.account['USDT']
(res.total/10000).plot(figsize=(12,4),grid = True);
df[symbols].mean(axis=1).plot(figsize=(12,4),grid=True);
Conclusion
In general, 2021 was a big bull market for copy currencies and a desolate year for BTC. The market value of BTC has fallen from 70% at the beginning of the year to 40% now, which is already the lowest level in history. Therefore, the average profit of buying copycat currency symbols and holding them in the past year was much higher than that of holding BTC. Looking forward to 2022, if you think that there are still several hundred times of currencies born in the current market in the future, you can boldly diversify the currency symbols you are holding and wait patiently. If you are particularly optimistic about a few currency symbols or the average market, you can use the rotation strategy to obtain excess profits without thinking. If you agree that things will develop in the opposite direction when they become extreme, you can bottom-fish BTC for better profits and security.