Summary
Until now, secondary market transactions have been flooded with a variety of trading methods. Among them, how to “entering the lowest price” and “escaping the highest price” has always been a trading method that many traders have been diligently seeking. In this article, we will using FMZ platform to achieve a bottom shape ZDZB strategy.
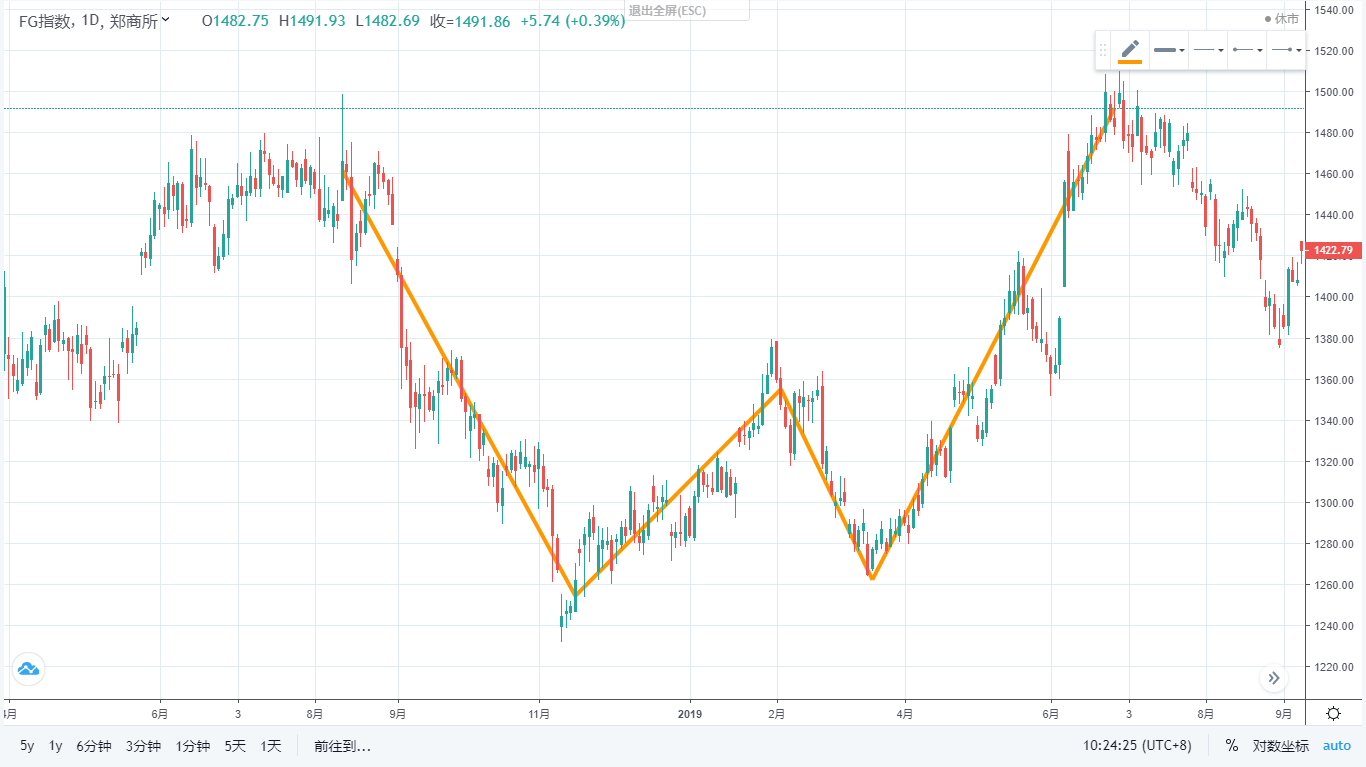
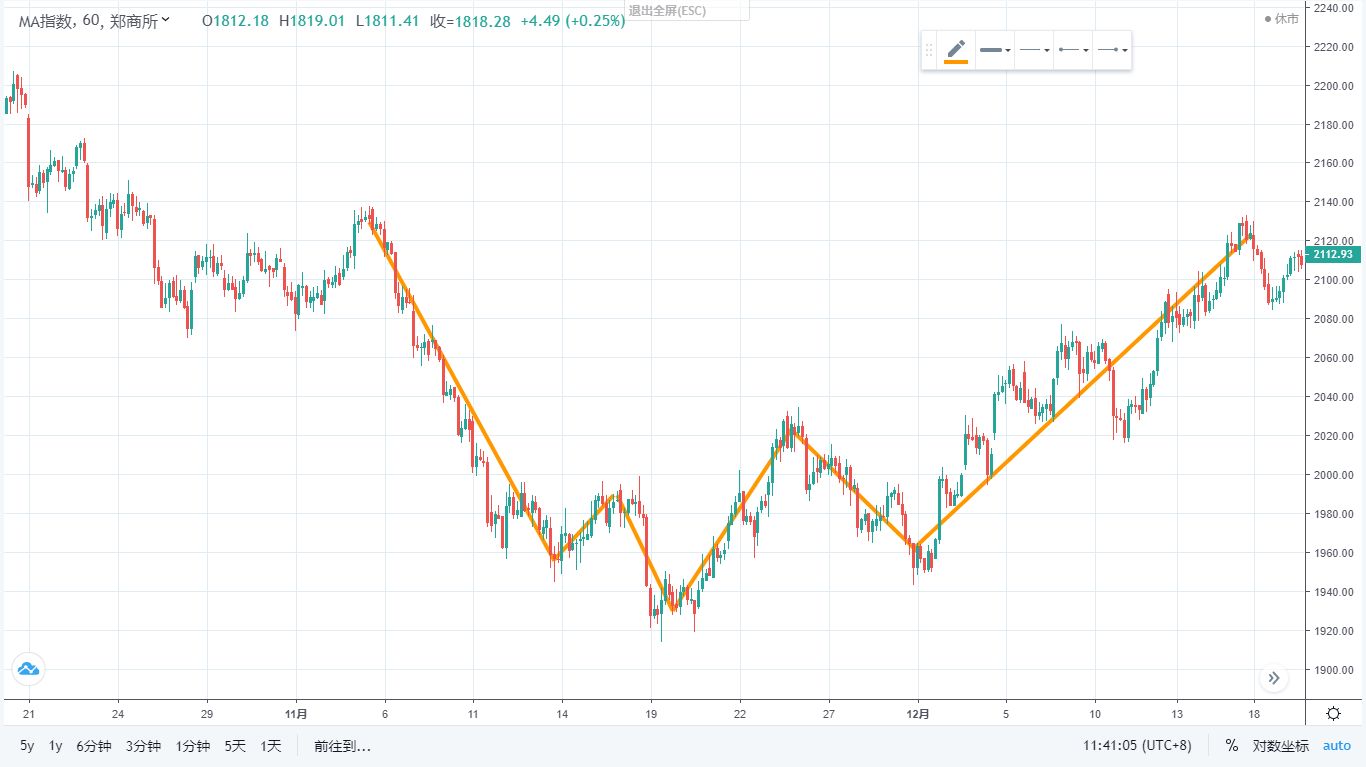
Top and bottom patterns
Unlike stocks trading, futures do not fall until they are delisted from the exchange. If you pull the time period large enough, you will find that its price fluctuates up and down according to a certain cycle, even in a small cycle. So from a speculative perspective, the futures market is more pure than the stock market. With regard to the evolution of the top and bottom patterns, many and many categories have been derived.
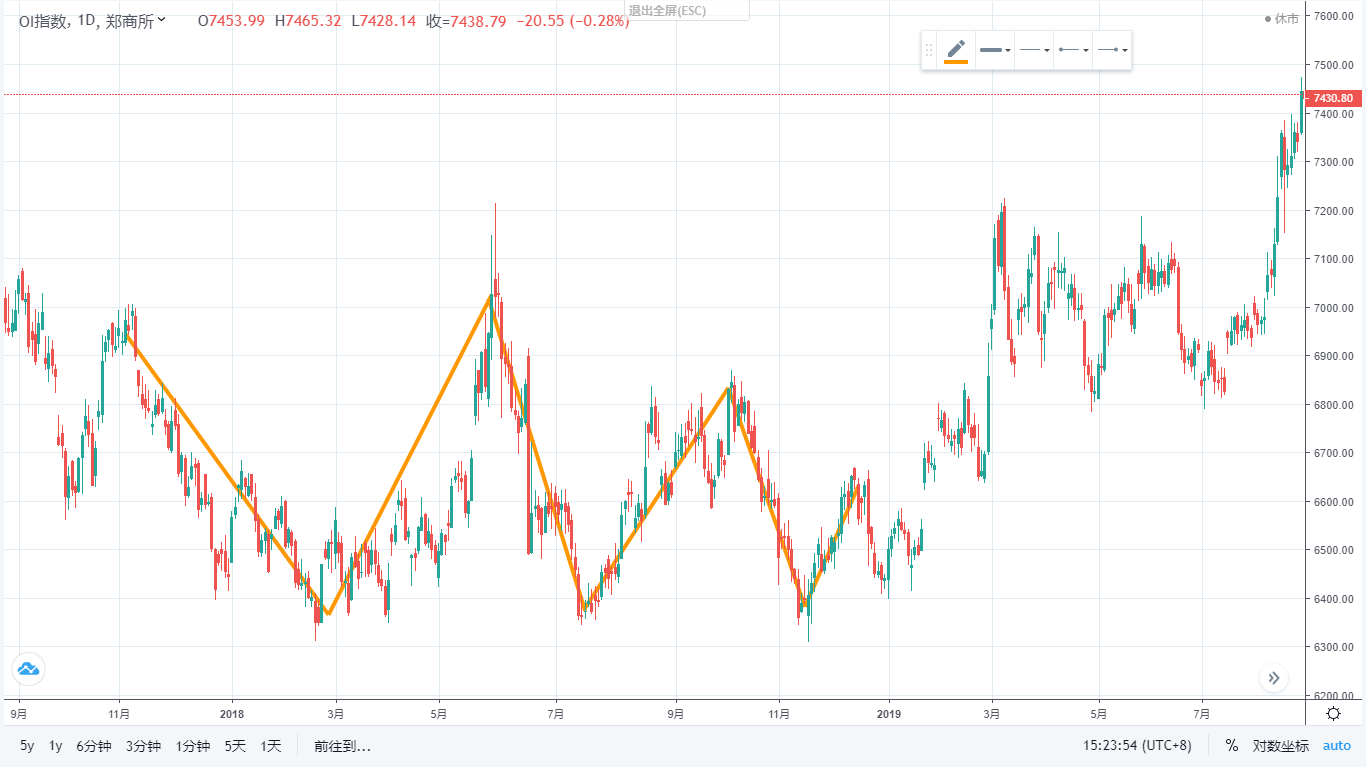
Double top and bottom
The double top and bottom are also called M top and W bottom, this pattern often appears in the price trend of K line. The double top is composed of two similar high points, and its shape is like the English letter M. The double bottom is composed of two similar low points, and its shape is like the English letter W.
As shown by the double bottom in the chart above, when the price continued to fall to the first low, and then rebounded to the middle relative high and low, then the price fell to the second low, these two lows are almost at the same level. Then formed a double bottom form.
Head and shoulders
The “head and shoulders” is a typical trend reversal pattern. The top of the “head and shoulders” generally appears at the beginning of the rising market, and the bottom of the “head and shoulders” generally appears at the end of the falling market. In the figure, it is composed of “left shoulder”, “top bottom”, “right shoulder”. As shown below:
As can be seen from the above figure, the “head and shoulders” contains three consecutive troughs, of which the middle peak is the highest position of this wave trend. The left and right sides of the middle peak are the left and right shoulders, and the left and right shoulders are relatively low. Their prices are roughly at the same level. The line segment formed by the trough connecting the left shoulder and the right shoulder is the neckline, which supports the head and shoulders.
Triple top and bottom
The triple top and bottom is an extension of the head and shoulder top bottom, and is also a compound form of the double top and bottom. Although the probability of the triple top and bottom pattern is small, it has a higher success rate than the former two. Once the pattern is formed, it will be very large.
The above picture is a triple top and bottom. In this price trend, the three bottoms are roughly at the same price level, forming a strong support area. Unless the price has a major breakthrough, it is difficult to fall to the triple bottom. In fact, there are many forms of top-to-bottom transitions, such as: bottom triangle, convergence-diffusion triangle, diamond, flag, circular arc, etc.
What is the bottom indicator
The bottom indicator is abbreviated as ZDZB, which is a trading method to assist buying at the rather low price. We often hear the word “breaking out buying”, which is indeed a better trading method in the trend market, but this method has great limitations, especially in the shock market, it is easy to execute at the highest price, fault-tolerant cost is high. Therefore, someone thought of a method of buying at the low prices. The advantage of this method is that even if you buy it wrong, the cost of stop loss is very small. The bottom indicator gives us a direction.
Calculate the bottom indicator
The calculation method of the bottom indicator is very simple, using the period of the past 125 days as the numerator and the period of the past 125 days as the denominator. The calculated number is then taken as the moving average of N days.
The FMZ platform MY language formula as follows:
COUNT(CLOSE>=REF(CLOSE,1),N1)/COUNT(CLOSE<REF(CLOSE,1),N1)
Bottom indicator usage
In theory, price rise more and fall less is a long position; and fall more and rise less is a short position. If the indicator is above 1, it is a bull market , while if the indicator is below 1, it is a bear market. Through this comparison, we can use historical data as a reference to position the current market.
If the bottom indicator is used independently, the signal will be too sensitive, which will lead to frequent opening and closing. Therefore, in order to solve this problem, the bottom indicator needs to be smoothed again on average. In addition, you can use different periods to average the bottoming indicators again. Thus, two moving averages are generated, and finally the signal of opening and closing positions can be generated by crossing the two moving averages.
Complete strategy
(*backtest
start: 2020-01-01 00:00:00
end: 2020-07-04 00:00:00
period: 1h
basePeriod: 1h
exchanges: [{"eid":"Futures_CTP","currency":"FUTURES"}]
*)

//Ratio of the number of CLOSE>=REF(CLOSE,1) in N1 cycle to the number of CLOSE<REF(CLOSE,1) in N1 cycle
A:=COUNT(CLOSE>=REF(CLOSE,1),N1)/COUNT(CLOSE<REF(CLOSE,1),N1);
B:MA(A,N2);//Simple moving average of A in N2 period;
D:MA(A,N3);//Simple moving average of A in N3 period;
CROSS(B,D),BPK;//B up cross D, buy long;
CROSS(D,B),SPK;//D down cross B, sell short;
AUTOFILTER;
The complete strategy code has been published on the FMZ official website. Click https://www.fmz.com/strategy/217704 to copy the backtest.
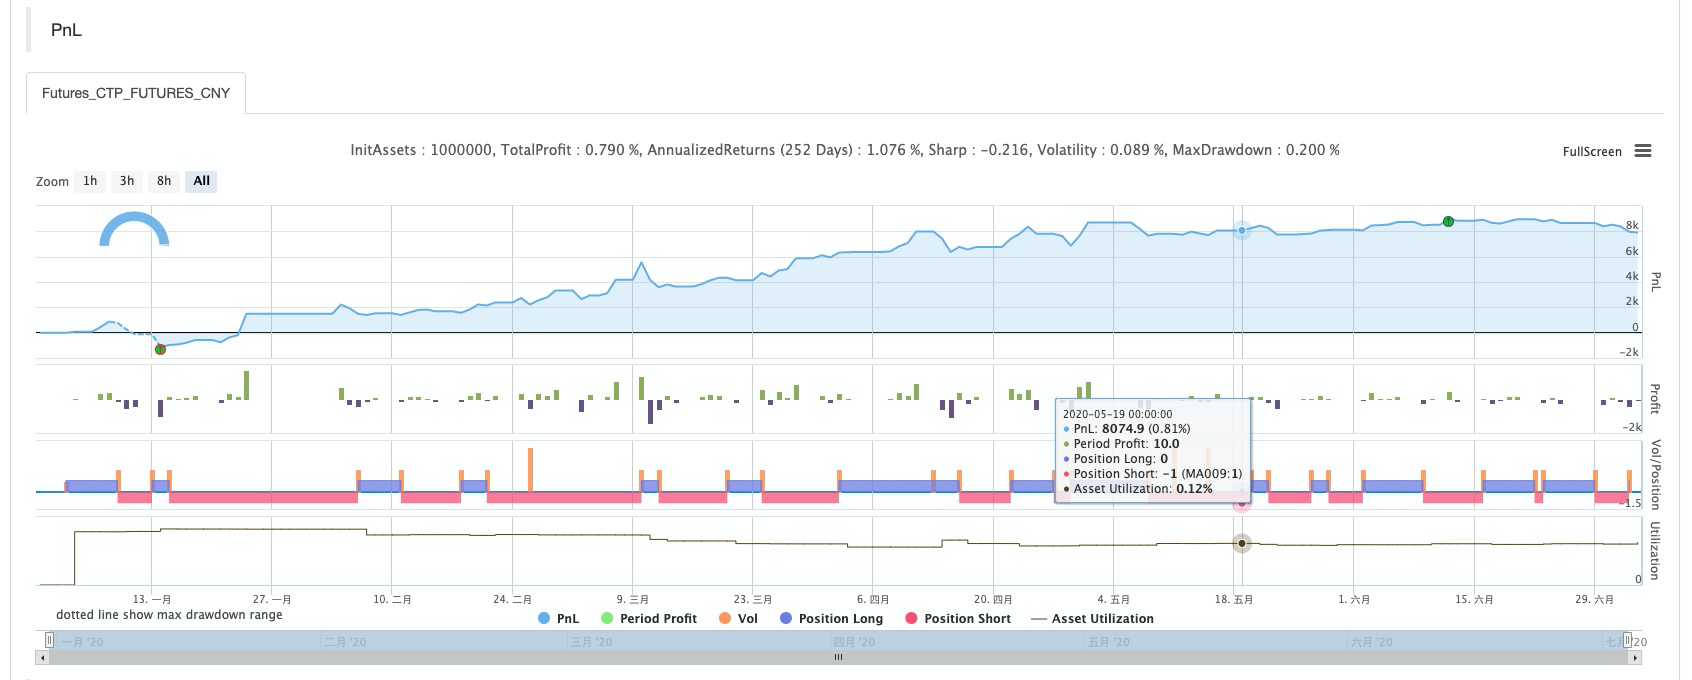
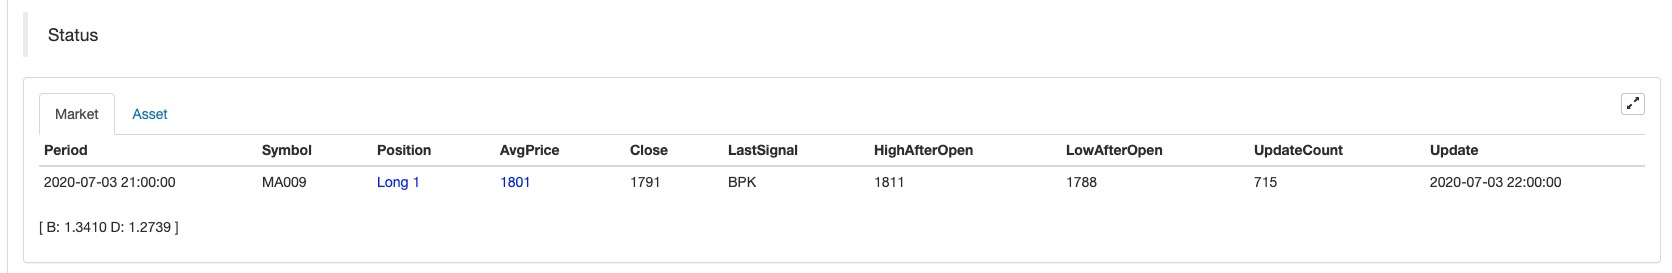
Strategy Backtest
Backtest configuration
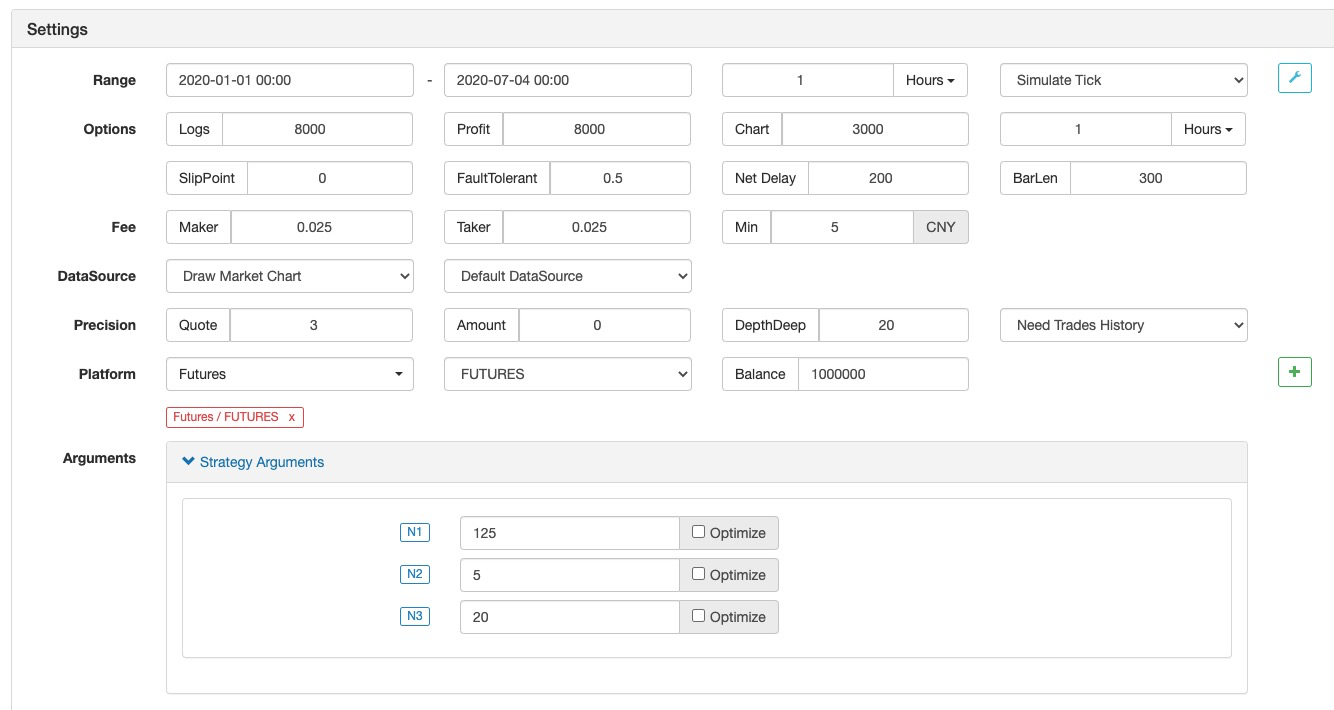
Performance Report
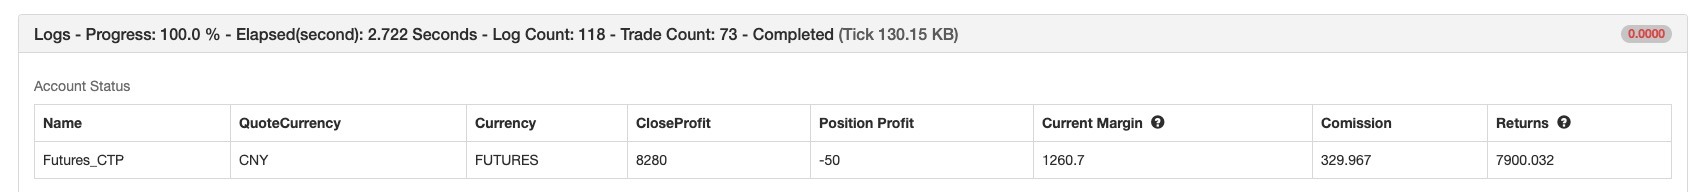
Capital Curve