In the previous articles, we have learned the basic concepts of so many cryptocurrency, programming, and quantitative trading. Finally, we can move to the topic and talk about the strategy itself. In this article, we will learn to implement a simple strategy together.
For “Grid Strategy”, someone who have made quantitative trading should have heard of it, but it doesn’t matter if you haven’t. Nowadays all exchanges have launched their own programmatic and quantitative trading functions, and the most and easiest-to-use strategy is grid strategy. However, the grid strategy functions and details provided by each exchange are different, since we plan to move to the cryptocurrency quantitative trading, why don’t we implement a grid strategy by ourselves?
At this time, someone may have said:
“I can’t write code!”
“I would get a headache when I saw the code!”
That’s true. It is indeed quite difficult for someone who are not major in computer software or have not been engaged in programming work to develop a complete trading strategy by themselves. Because you have to do a series of pre-work from the beginning of docking the exchange interface (maybe your trading logic program is only 100 lines, but other coding work to be done is quite a lot, and it is more difficult than writing trading logic.)
At this time, if you have a handy tool, it is quite simple, at least the difficulty is reduced by 70%. You can imagine how convenient and fast it is if you only write the trading logic itself, and all other exchange interface connection, signature verification, configuration files, operating environment construction, UI interface writing, interactive writing and so on are all ready-made.
Don’t believe it?
Let’s try it out!
Implement a simple spot grid strategy
The tool we use is: FMZ Quant Trading Platform (FMZ.COM). The core of grid strategy design actually is the logic of grid buying and selling, so this is something that must be clarified before designing a strategy. Our goal is to make the strategy design simple and easy to understand, so the fewer parameters and the simpler the logic, the better.
The following is the basic flow of designing a strategy:
1. Summary of strategic needs
Simply put, they are what your strategy will do, how to do, and what functions it has. That information can be written in a document (something like notebook) before you actually write the strategy code. It is very simple to develop strategies on FMZ. The platform provides you with solutions to these requirements, and you don’t need to write these requirements in some notebook (which is not very convenient to manage). You can write the strategy requirements directly in the strategy note.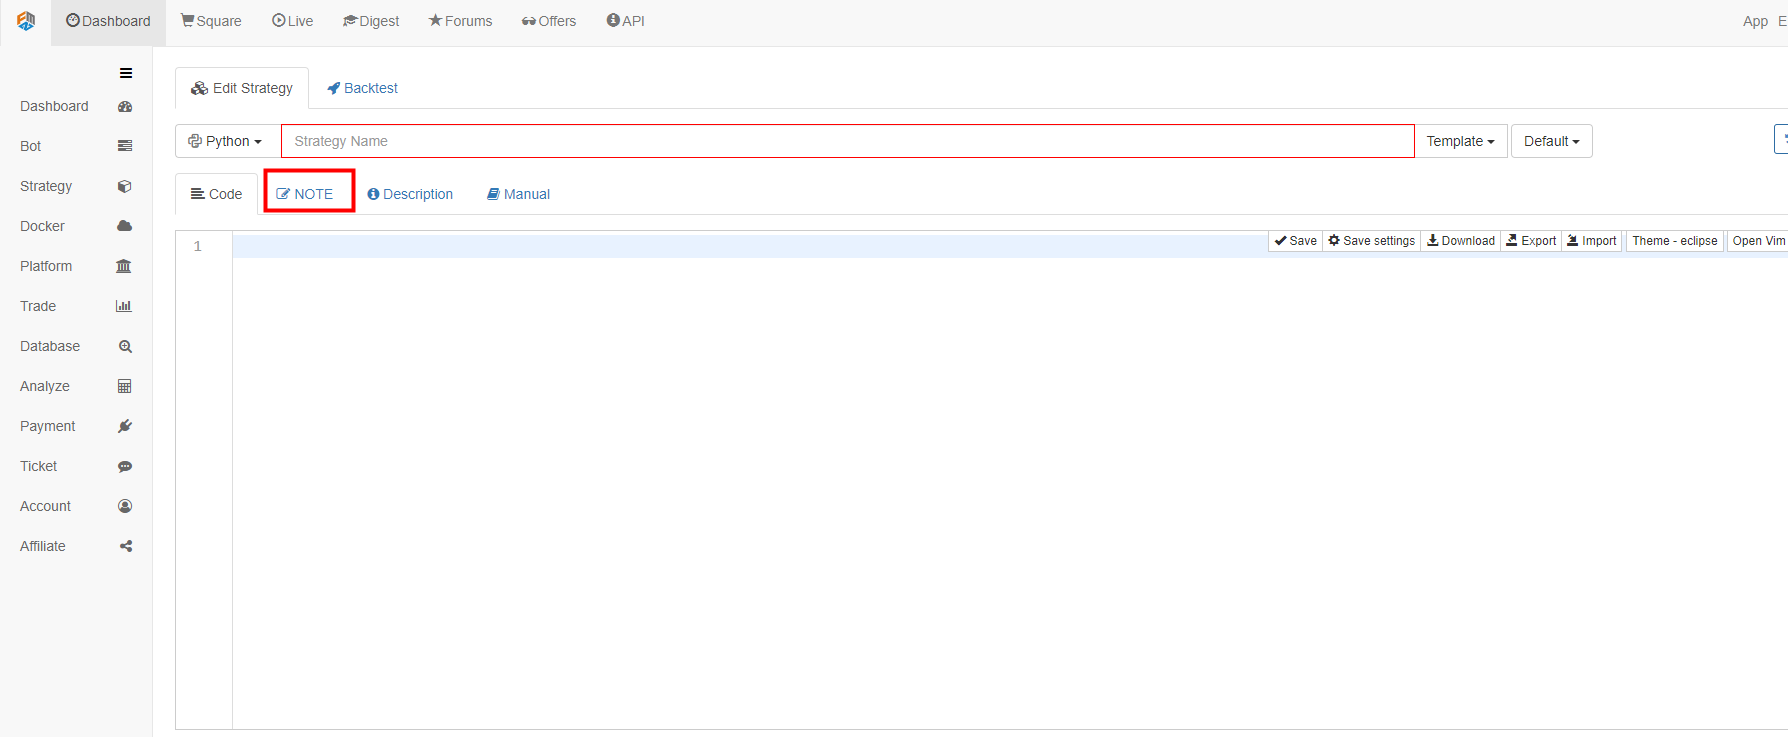 Remember to save the strategy when you finish writing, and then we continue to write the strategy requirements (those requiremnts are not unchanged; you can record and develop at the same time).
The strategy is designed as a spot taring strategy; the trading pair is XXX_USDT, such as BTC_USDT.
The grid is designed to be equal difference interval; ti be simple, the interval between the two adjacent dots in the grid is a fixed spread.
The grid is designed to be an infinite grid that can extend without limits.
The way of ordering uses market order.
2.Construct grid data structure:For the unclear ideas, we can plot to analyze at the beginning.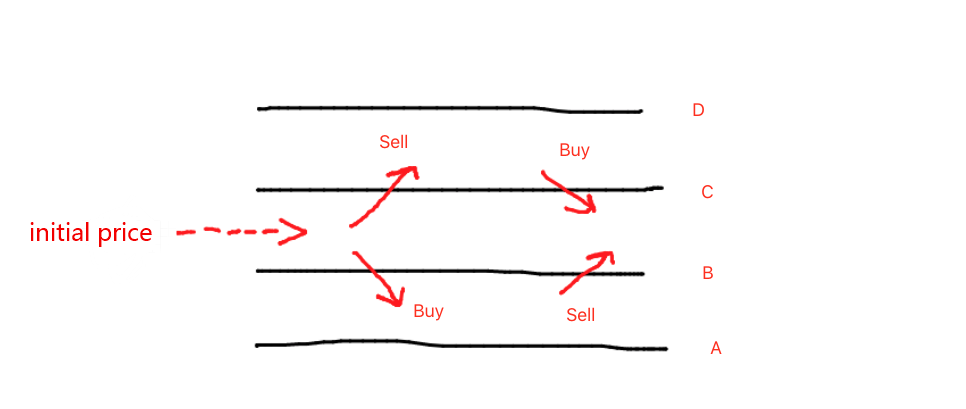 Grids can be constructed in both up and down directions from the base point, the initial price at the beginning. The so-called grid is composed of layers of bid lines and ask lines. Looking at the graph, we can see that each line has two possibilities:
function createNet(begin, diff) {   // begin, diff are parameters, begin is the initial price, diff is the grid spacing (the spacing of the equal difference grid is the price)
    var oneSideNums = 10            // The grid generates 10 bars on the upward and downward sides. The above chart is a side of the generation of 2 bars (AB side, CD side) and the generation of 10 bars, you can imagine them by yourself.
    var up = []                     // Used to store the upward "grid line" data structure
    var down = []                   // Used to store the downward "grid line" data structure
    for (var i = 0 ; i < oneSideNums ; i++) {    // Determine the number of times according to the size of oneSideNums, and construct the "grid line" data structure cyclically
        var upObj = {                            // Construct an upward "gridline" data structure
            buy : false,                         // Buy marker, initial marker is false, meaning no buy
            sell : false,                        // Sell marker ...
            price : begin + diff / 2 + i * diff, // The price level represented by this "grid line" can be observed according to the cycle, and the price level is rising in turn.
        }
        up.push(upObj)                           // The constructed "gridline" data structure is placed into the up array

        var j = (oneSideNums - 1) - i            // The change in j during the loop is: 9 ~ 0
        var downObj = {
            buy : false,
            sell : false,
            price : begin - diff / 2 - j * diff,
        }
        if (downObj.price <= 0) {                // The price cannot be less than or equal to 0
            continue
        }
        down.push(downObj)                       // The constructed "gridline" data structure is placed in down array
    }

    return down.concat(up)                       // Add up after down to form a grid array structure with grid line prices from small to large
}
You can individually perform the function to see the result. The “Debug tool” on FMZ or “Backtest system” are all very convenient to debug this kind of short codes.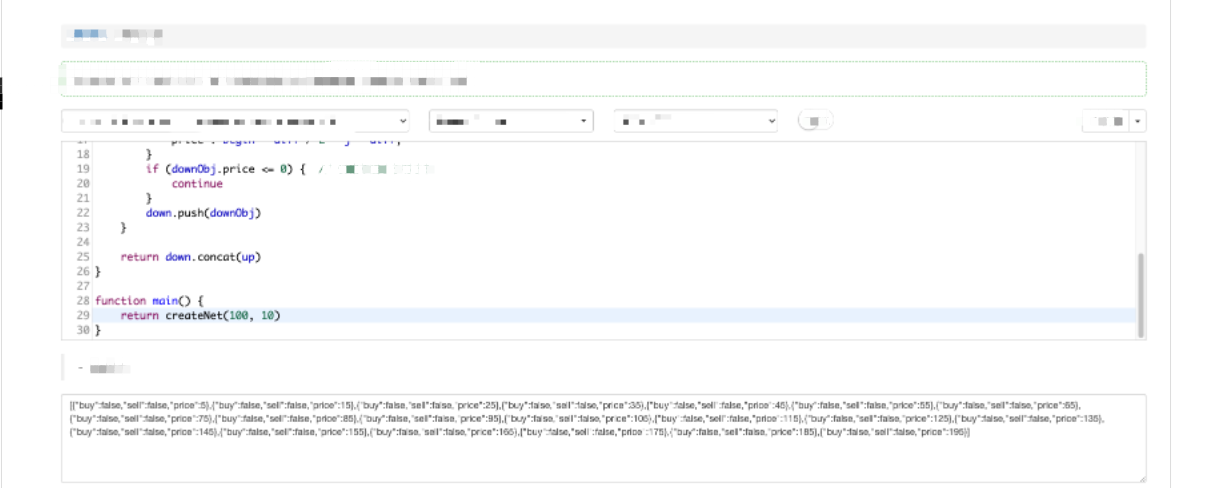 The constructed data can be observed.
[
    {"buy":false,"sell":false,"price":5},
    {"buy":false,"sell":false,"price":15},
    {"buy":false,"sell":false,"price":25},
    {"buy":false,"sell":false,"price":35},
    {"buy":false,"sell":false,"price":45},
    {"buy":false,"sell":false,"price":55},
    {"buy":false,"sell":false,"price":65},
    {"buy":false,"sell":false,"price":75},
    {"buy":false,"sell":false,"price":85},
    {"buy":false,"sell":false,"price":95},
    {"buy":false,"sell":false,"price":105},  // 100 is the starting price, starting from 105 and going up the first line, with an interval of 10
    {"buy":false,"sell":false,"price":115},  // ...
    {"buy":false,"sell":false,"price":125},
    {"buy":false,"sell":false,"price":135},
    {"buy":false,"sell":false,"price":145},
    {"buy":false,"sell":false,"price":155},
    {"buy":false,"sell":false,"price":165},
    {"buy":false,"sell":false,"price":175},
    {"buy":false,"sell":false,"price":185},
    {"buy":false,"sell":false,"price":195}
]
1 is a time, t2 is a time after t1; to judge whether the line C is up crossed or not, we only need to judge P1 < C and P2 > C.
In the same way, to judge whether the line B is down crossed, we only need to judge P1 > B and P3 < B.
At that time, we only need to traverse each line in the grid array (traversing is commonly said to be checking one by one), and judge whether up cross or down cross. Is it very simple?I have caught the action of the price upcrossing and downcrossing. Can I place an order when these actions are triggered?
Obviously it is not possible. If the price goes up and down repeatedly on one line, wouldn’t it waste the handling fee for repeated trades at the same price? Therefore, there are still a series of judgment conditions after triggering the upcross and downcross, which requires the use of the buy/sell mark in the grid line data structure we just constructed (for example: {“buy”:false,”sell “:false,”price”:5}).
Thanks for reading, we will continue to explain and learn in the next issue.