In the previous article, we explained the trading logic analysis of a simple grid strategy. In this article, we will continue to complete the design of this tutorial strategy.
- Trading logic analysis
As we mentioned in the previous article, you can trigger a trade action by traversing each grid line and judging the current price crossing above or below. But in fact, there are still a lot of logic details, and beginners who don’t understand strategy writing are often prone to form a misunderstanding that “the logic is very simple, the code should only be a few lines, but there are still a lot of details found in actual writing.” The first detail we have to consider is the design of the infinite grid. Do you remember we designed a functioncreateNetto generate the initial grid data structure together in the previous article? This function generates a grid data structure with a finite number of grid lines. So what if the price goes beyond the boundaries of this grid data structure (beyond the top grid line where the price is the highest, and the bottom grid line where the price is the lowest) when the strategy is running?
So we need to add an extension mechanism to the grid data structure first. Let’s get started writing the strategy main function, which is the code where the strategy starts to execute
  var diff = 50                                 // Global variables and grid spacing can be designed as parameters for easy explanation. We write this parameter into the code.
  function main() {
      // After the real bot starts running, execute the strategy code from here
      var ticker = _C(exchange.GetTicker)       // To get the latest market data ticker, please refer to the FMZ API documentation for the structure of the ticker data: https://www.fmz.com/api#ticker
      var net = createNet(ticker.Last, diff)    // The function we designed in the previous article to construct the grid data structure initially, here we construct a grid data structure net

      while (true) {                            // Then the program logic enters this while infinite loop, and the strategy execution will continue to execute the code within the {} symbol here.
          ticker = _C(exchange.GetTicker)       // The first line of the infinite loop code section, get the latest market data and update it to the ticker variable
          // Check the grid range
          while (ticker.Last >= net[net.length - 1].price) {
              net.push({
                  buy : false,
                  sell : false,
                  price : net[net.length - 1].price + diff,
              })
          }
          while (ticker.Last <= net[0].price) {
              var price = net[0].price - diff
              if (price <= 0) {
                  break
              }
              net.unshift({
                  buy : false,
                  sell : false,
                  price : price,
              })
          }

          // There are other codes...
      }
  }
Making the grid data structure extendable is this code (excerpted from the code above):
        // Check the grid range
        while (ticker.Last >= net[net.length - 1].price) {   // If the price exceeds the grid line of the highest price of the grid
            net.push({                                       // Just add a new grid line after the grid line with the highest price of the grid
                buy : false,                                 // Initialize sell marker
                sell : false,                                // Initialize buy marker
                price : net[net.length - 1].price + diff,    // dd a grid spacing to the previous highest price
            })
        }
        while (ticker.Last <= net[0].price) {                // If the price is lower than the grid line of the lowest price of the grid
            var price = net[0].price - diff                  // Different from adding upwards, it should be noted that the price of adding new grid lines downwards cannot be less than or equal to 0, so it is necessary to judge here
            if (price <= 0) {                                // Less than or equal to 0 will not be added, jump out of this loop
                break
            }
            net.unshift({                                    // Add a new grid line just before the grid line with the lowest price of the grid
                buy : false,
                sell : false,
                price : price,
            })
        }
The next step is to consider how to implement the trading trigger specifically.
  var diff = 50
  var amount = 0.002       // Add a global variable, which can also be designed as a parameter. Of course, for the sake of simplicity, we also write it in the strategy code.
                           // This parameter controls the trade volume each time a trade is triggered on the grid line
  function main() {
      var ticker = _C(exchange.GetTicker)
      var net = createNet(ticker.Last, diff)
      var preTicker = ticker       // Before the main loop (fixed loop) starts, set a variable to record the last market data
      while (true) {
          ticker = _C(exchange.GetTicker)
          // Check the grid range
          while (ticker.Last >= net[net.length - 1].price) {
              net.push({
                  buy : false,
                  sell : false,
                  price : net[net.length - 1].price + diff,
              })
          }
          while (ticker.Last <= net[0].price) {
              var price = net[0].price - diff
              if (price <= 0) {
                  break
              }
              net.unshift({
                  buy : false,
                  sell : false,
                  price : price,
              })
          }

          // Retrieve grid
          for (var i = 0 ; i < net.length ; i++) {     // Iterate over all grid lines in the grid data structure
              var p = net[i]
              if (preTicker.Last < p.price && ticker.Last > p.price) {         // Above the SMA, sell, the current node has already traded, regardless of SELL BUY, it will no longer be traded
                  if (i != 0) {
                      var downP = net[i - 1]
                      if (downP.buy) {
                          exchange.Sell(-1, amount, ticker)
                          downP.buy = false
                          p.sell = false
                          continue
                      }
                  }
                  if (!p.sell && !p.buy) {
                      exchange.Sell(-1, amount, ticker)
                      p.sell = true
                  }
              } else if (preTicker.Last > p.price && ticker.Last < p.price) {  // Below the SMA, buy
                  if (i != net.length - 1) {
                      var upP = net[i + 1]
                      if (upP.sell) {
                          exchange.Buy(-1, amount * ticker.Last, ticker)
                          upP.sell = false
                          p.buy = false
                          continue
                      }
                  }
                  if (!p.buy && !p.sell) {
                      exchange.Buy(-1, amount * ticker.Last, ticker)
                      p.buy = true
                  }
              }
          }
          preTicker = ticker    // Record the current market data in preTicker, and in the next cycle, use it as a comparison between the "previous" market data and the latest one to judge whether to be above the SMA or below the SMA.
          Sleep(500)
      }
  }
It can be seen that:
- Condition for crossing above the grid lines:
preTicker.Last < p.price && ticker.Last > p.price - Condition for crossing below the grid lines:
preTicker.Last > p.price && ticker.Last < p.priceThis is what we said in the previous post: -
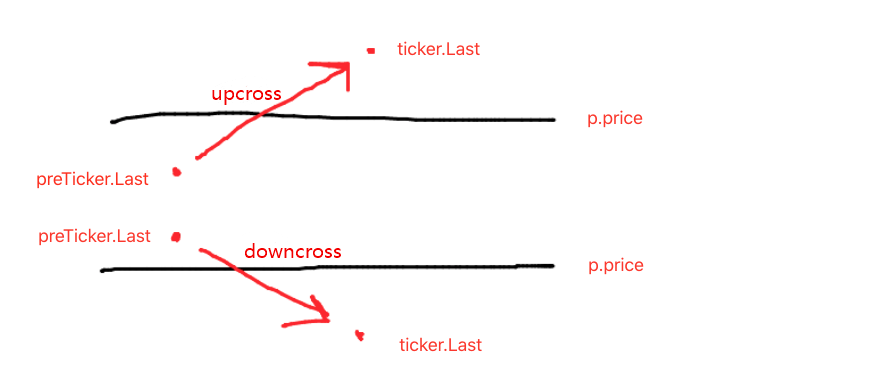
- Judging whether to be above the SMA or below the SMA is only the first step in judging whether an order can be placed, and it is also necessary to judge the marks in the grid line data. If it is above the SMA, it is judged that the price is lower than the current grid line and the buy mark on the nearest grid line. If the value of the buy mark is true, it means that the previous grid line has been bought, and reset the previous buy mark to false, and the reset current grid line sell mark to false. After judging the conditions, if there is no trigger, continue to judge. If the buy/sell marks on the current grid line are both false, it means that the current grid line can be traded. Since it is above the SMA, we will perform a sell operation here. After execution, mark the current grid line sell mark true. The processing logic is the same for being below the SMA (left for the beginners to think about here).
Complete strategy backtesting
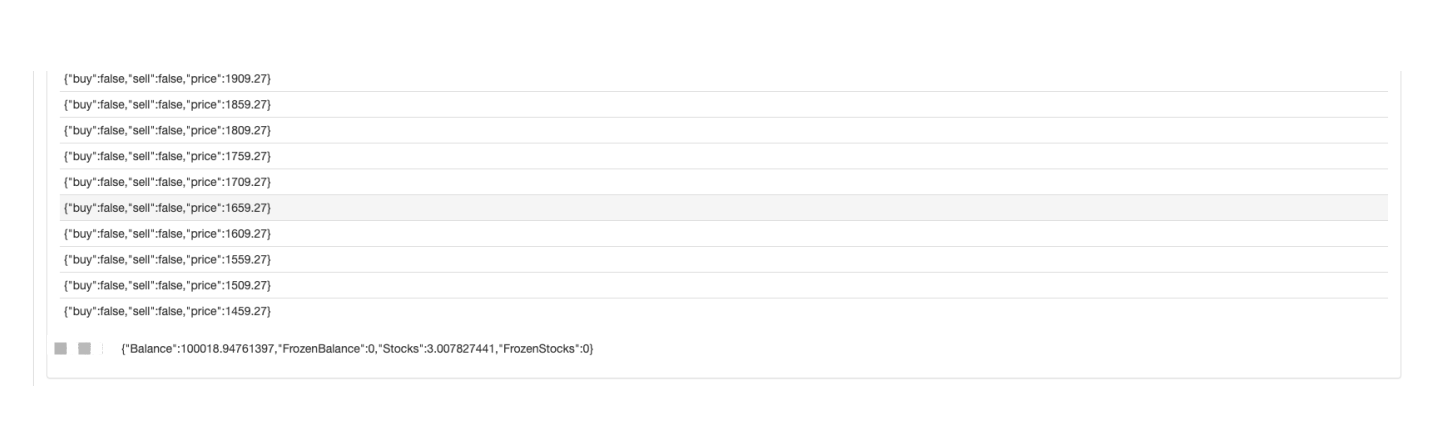
In order to see some data during backtesting, a function showTbl is written to display the data.
function showTbl(arr) {
    var tbl = {
        type : "table",
        title : "grid",
        cols : ["grid information"],
        rows : []
    }
    var arrReverse = arr.slice(0).reverse()
    _.each(arrReverse, function(ele) {
        var color = ""
        if (ele.buy) {
            color = "#FF0000"
        } else if (ele.sell) {
            color = "#00FF00"
        }
        tbl.rows.push([JSON.stringify(ele) + color])
    })
    LogStatus(_D(), "\n`" + JSON.stringify(tbl) + "`", "\n account Information:", exchange.GetAccount())
}
Complete strategy code:
/*backtest
start: 2021-04-01 22:00:00
end: 2021-05-22 00:00:00
period: 1d
basePeriod: 1m
exchanges: [{"eid":"OKEX","currency":"ETH_USDT","balance":100000}]
*/

var diff = 50
var amount = 0.002
function createNet(begin, diff) {
    var oneSideNums = 10
    var up = []
    var down = []
    for (var i = 0 ; i < oneSideNums ; i++) {
        var upObj = {
            buy : false,
            sell : false,
            price : begin + diff / 2 + i * diff,
        }
        up.push(upObj)

        var j = (oneSideNums - 1) - i
        var downObj = {
            buy : false,
            sell : false,
            price : begin - diff / 2 - j * diff,
        }
        if (downObj.price <= 0) {  // The price cannot be less than or equal to 0
            continue
        }
        down.push(downObj)
    }

    return down.concat(up)
}

function showTbl(arr) {
    var tbl = {
        type : "table",
        title : "grid",
        cols : ["grid Information"],
        rows : []
    }
    var arrReverse = arr.slice(0).reverse()
    _.each(arrReverse, function(ele) {
        var color = ""
        if (ele.buy) {
            color = "#FF0000"
        } else if (ele.sell) {
            color = "#00FF00"
        }
        tbl.rows.push([JSON.stringify(ele) + color])
    })
    LogStatus(_D(), "\n`" + JSON.stringify(tbl) + "`", "\n account Information:", exchange.GetAccount())
}

function main() {
    var ticker = _C(exchange.GetTicker)
    var net = createNet(ticker.Last, diff)
    var preTicker = ticker
    while (true) {
        ticker = _C(exchange.GetTicker)
        // Check the grid range
        while (ticker.Last >= net[net.length - 1].price) {
            net.push({
                buy : false,
                sell : false,
                price : net[net.length - 1].price + diff,
            })
        }
        while (ticker.Last <= net[0].price) {
            var price = net[0].price - diff
            if (price <= 0) {
                break
            }
            net.unshift({
                buy : false,
                sell : false,
                price : price,
            })
        }

        // Retrieve grid
        for (var i = 0 ; i < net.length ; i++) {
            var p = net[i]
            if (preTicker.Last < p.price && ticker.Last > p.price) {         // Being above the SMA, sell, the current node has already traded, regardless of SELL BUY, it will no longer be traded
                if (i != 0) {
                    var downP = net[i - 1]
                    if (downP.buy) {
                        exchange.Sell(-1, amount, ticker)
                        downP.buy = false
                        p.sell = false
                        continue
                    }
                }
                if (!p.sell && !p.buy) {
                    exchange.Sell(-1, amount, ticker)
                    p.sell = true
                }
            } else if (preTicker.Last > p.price && ticker.Last < p.price) {  // Being below the SMA, buy
                if (i != net.length - 1) {
                    var upP = net[i + 1]
                    if (upP.sell) {
                        exchange.Buy(-1, amount * ticker.Last, ticker)
                        upP.sell = false
                        p.buy = false
                        continue
                    }
                }
                if (!p.buy && !p.sell) {
                    exchange.Buy(-1, amount * ticker.Last, ticker)
                    p.buy = true
                }
            }
        }

        showTbl(net)
        preTicker = ticker
        Sleep(500)
    }
}
Strategy Backtest:
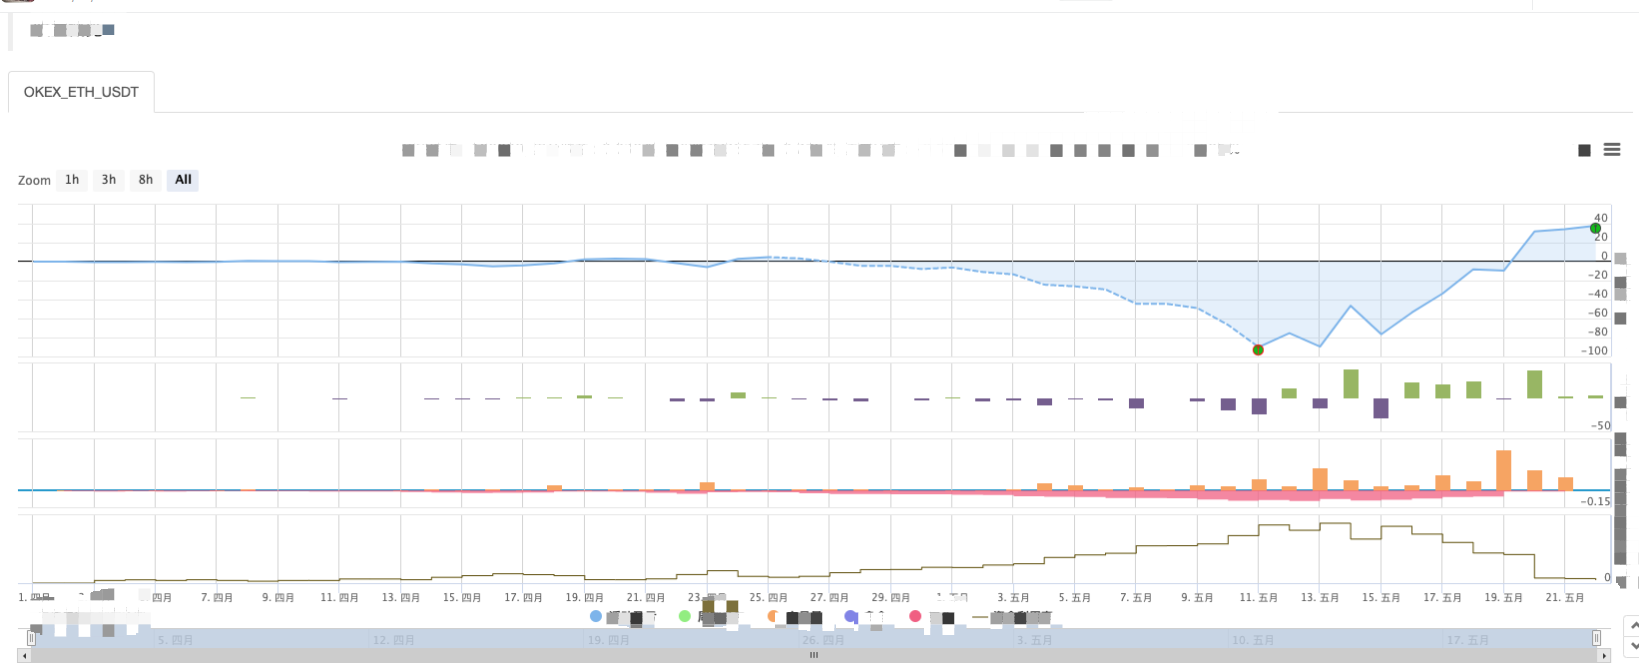
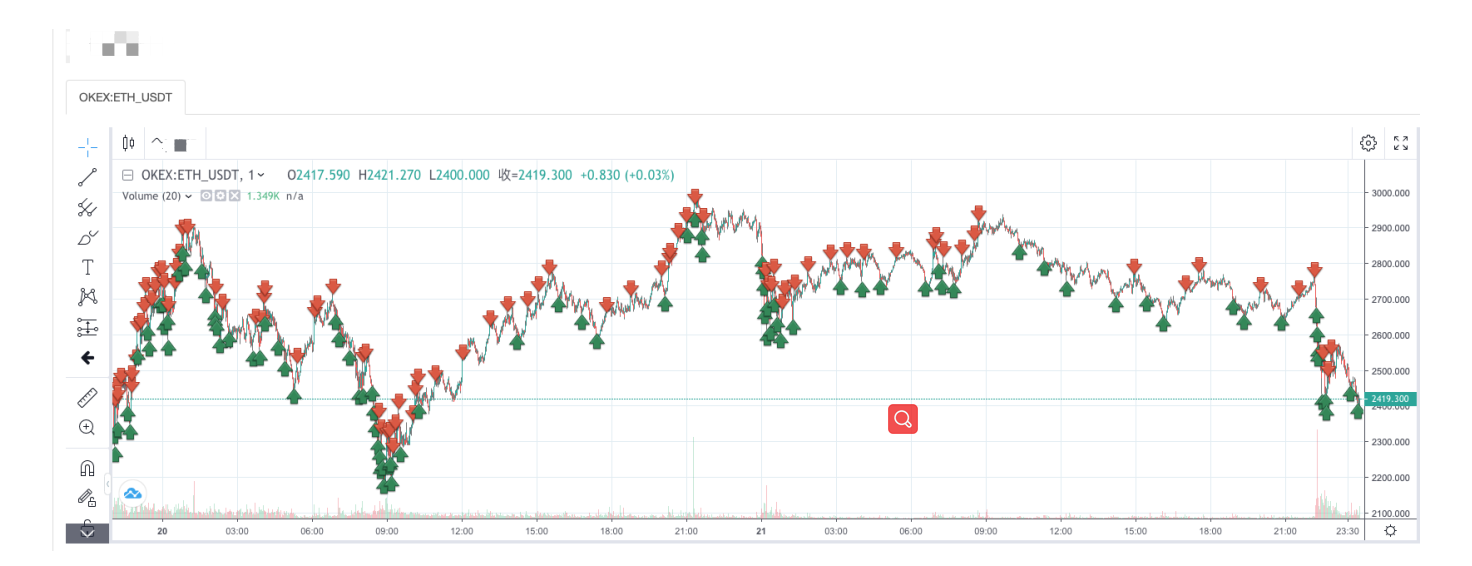
You can see the characteristics of the grid strategy. When there is a trending market, there will be a large floating loss, and the return will rebound in a volatile market.
Therefore, the grid strategy is not risk-free. The spot strategy can still hold on to make it even, while the grid strategy of futures contracts is more risky and needs to set the grid parameters conservatively.