In this issue, we are going to discuss a “Magic Double EMA Strategy” from YouTube, which is known as the “the Killer of Stock and Cryptocurrency Market”. I watched the video and learned that this strategy is a trading view Pine language strategy that uses 2 trading view indicators. The backtesting effect in the video is very good, and FMZ also supports the Pine language of Trading View, so I can’t help but want to backtest and analysis by myself. So let’s start the work! Let’s replicate the strategy in the video.
Indicators used by the strategy
- EMA Indicators
For the sake of design simplicity, we will not use the Moving Average Exponential listed in the video, we will use the built-in ta.ema of the trading view instead (it is actually the same).
- VuManChu Swing Free Indicators
This is an indicator on Trading View, we need to go to Trading View and pick up the source code.
Code of VuManChu Swing Free:
// This source code is subject to the terms of the Mozilla Public License 2.0 at https://mozilla.org/MPL/2.0/

// Credits to the original Script - Range Filter DonovanWall https://www.tradingview.com/script/lut7sBgG-Range-Filter-DW/
// This version is the old version of the Range Filter with less settings to tinker with

//@version=4
study(title="Range Filter - B&S Signals", shorttitle="RF - B&S Signals", overlay=true)

//-----------------------------------------------------------------------------------------------------------------------------------------------------------------
//Functions
//-----------------------------------------------------------------------------------------------------------------------------------------------------------------

//Range Size Function
rng_size(x, qty, n)=>
//    AC       = Cond_EMA(abs(x - x[1]), 1, n)
    wper      = (n*2) - 1
    avrng     = ema(abs(x - x[1]), n)
    AC = ema(avrng, wper)*qty
    rng_size = AC

//Range Filter Function
rng_filt(x, rng_, n)=>
    r          = rng_
    var rfilt  = array.new_float(2, x)
    array.set(rfilt, 1, array.get(rfilt, 0))
    if x - r > array.get(rfilt, 1)
        array.set(rfilt, 0, x - r)
    if x + r < array.get(rfilt, 1)
        array.set(rfilt, 0, x + r)
    rng_filt1 = array.get(rfilt, 0)

    hi_band   = rng_filt1 + r
    lo_band   = rng_filt1 - r
    rng_filt  = rng_filt1
    [hi_band, lo_band, rng_filt]

//-----------------------------------------------------------------------------------------------------------------------------------------------------------------
//Inputs
//-----------------------------------------------------------------------------------------------------------------------------------------------------------------

//Range Source
rng_src = input(defval=close, type=input.source, title="Swing Source")

//Range Period
rng_per = input(defval=20, minval=1, title="Swing Period")

//Range Size Inputs
rng_qty   = input(defval=3.5, minval=0.0000001, title="Swing Multiplier")

//Bar Colors
use_barcolor = input(defval=false, type=input.bool, title="Bar Colors On/Off")

//-----------------------------------------------------------------------------------------------------------------------------------------------------------------
//Definitions
//-----------------------------------------------------------------------------------------------------------------------------------------------------------------

//Range Filter Values
[h_band, l_band, filt] = rng_filt(rng_src, rng_size(rng_src, rng_qty, rng_per), rng_per)

//Direction Conditions
var fdir = 0.0
fdir    := filt > filt[1] ? 1 : filt < filt[1] ? -1 : fdir
upward   = fdir==1 ? 1 : 0
downward = fdir==-1 ? 1 : 0

//Trading Condition
longCond = rng_src > filt and rng_src > rng_src[1] and upward > 0 or rng_src > filt and rng_src < rng_src[1] and upward > 0
shortCond = rng_src < filt and rng_src < rng_src[1] and downward > 0 or rng_src < filt and rng_src > rng_src[1] and downward > 0

CondIni = 0
CondIni := longCond ? 1 : shortCond ? -1 : CondIni[1]
longCondition = longCond and CondIni[1] == -1
shortCondition = shortCond and CondIni[1] == 1

//Colors
filt_color = upward ? #05ff9b : downward ? #ff0583 : #cccccc
bar_color  = upward and (rng_src > filt) ? (rng_src > rng_src[1] ? #05ff9b : #00b36b) :
             downward and (rng_src < filt) ? (rng_src < rng_src[1] ? #ff0583 : #b8005d) : #cccccc

//-----------------------------------------------------------------------------------------------------------------------------------------------------------------
//Outputs
//-----------------------------------------------------------------------------------------------------------------------------------------------------------------

//Filter Plot
filt_plot = plot(filt, color=filt_color, transp=67, linewidth=3, title="Filter")

//Band Plots
h_band_plot = plot(h_band, color=color.new(#05ff9b, 100), title="High Band")
l_band_plot = plot(l_band, color=color.new(#ff0583, 100), title="Low Band")

//Band Fills
fill(h_band_plot, filt_plot, color=color.new(#00b36b, 92), title="High Band Fill")
fill(l_band_plot, filt_plot, color=color.new(#b8005d, 92), title="Low Band Fill")

//Bar Color
barcolor(use_barcolor ? bar_color : na)

//Plot Buy and Sell Labels
plotshape(longCondition, title = "Buy Signal", text ="BUY", textcolor = color.white, style=shape.labelup, size = size.normal, location=location.belowbar, color = color.new(color.green, 0))
plotshape(shortCondition, title = "Sell Signal", text ="SELL", textcolor = color.white, style=shape.labeldown, size = size.normal, location=location.abovebar, color = color.new(color.red, 0))

//Alerts
alertcondition(longCondition, title="Buy Alert", message = "BUY")
alertcondition(shortCondition, title="Sell Alert", message = "SELL")
Strategy Logic
EMA indicator: the strategy uses two EMAs, one is the fast line (small period parameter) and the other is the slow line (large period parameter). The purpose of the double EMA moving averages is mainly to help us determine the direction of the market trend.
- long position arrangement
The fast line is above the slow line. - short position arrangement
The fast line is below the slow line.
VuManChu Swing Free Indicator: The VuManChu Swing Free indicator is used to send signals and judge whether to place an order in combination with other conditions. It can be seen from the VuManChu Swing Free indicator source code that the longCondition variable represents the buying signal and the shortCondition variable represents the selling signal. These two variables will be used for subsequent writing of placing order conditions.
Now let’s talk about the specific trigger conditions of the trading signal:
- Rules for entering long position:
The closing price of the positive K-line should be above the fast line of the EMA, the two EMAs should be a long position (fast line above the slow line), and the VuManChu Swing Free indicator should show a buy signal (longCondition is true). If the three conditions are met, this K-line is the key K-line for entry of the long position, and the closing price of this K-line is the entry position. - Rules for entering short position (contrary to the long position):
The closing price of the negative K-line should be below the fast line of the EMA, the two EMAs should be a short position (fast line below the slow line), and the VuManChu Swing Free indicator should show a sell signal (shortCondition is true). If the three conditions are met, the closing price of the K-line is the short entry position.
Is the trading logic very simple? Since the source video does not specify the profit stop and loss stop, I will use a moderate profit stop and loss stop method freely, using fixed points to stop loss, and tracking the profit stop.
Design of code
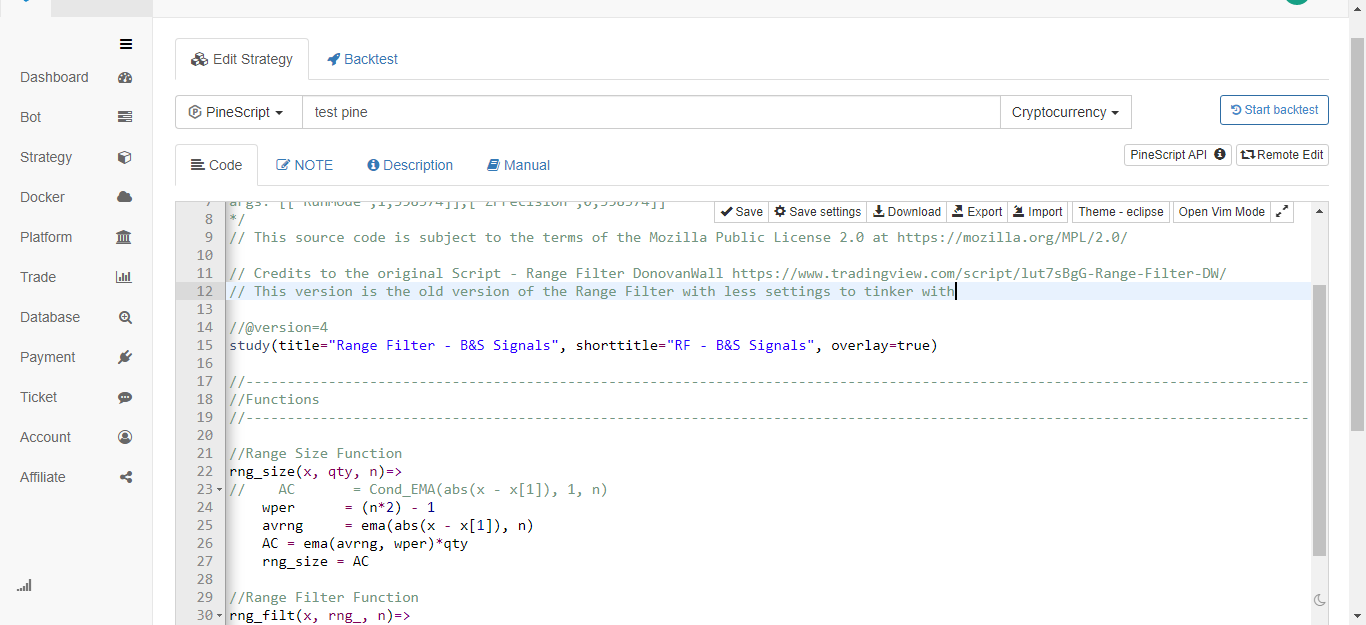
The code for the VuManChu Swing Free indicator, we put it into our strategy code directly without any change.
Then immediately afterwards, we write a piece of Pine language code that implements the trading function:
// extend
fastEmaPeriod = input(50, "fastEmaPeriod")         // fast line period
slowEmaPeriod = input(200, "slowEmaPeriod")        // slow line period
loss = input(30, "loss")                           // stop loss points
trailPoints = input(30, "trailPoints")             // number of trigger points for moving stop loss
trailOffset = input(30, "trailOffset")             // moving stop profit offset (points)
amount = input(1, "amount")                        // order amount

emaFast = ta.ema(close, fastEmaPeriod)             // calculate the fast line EMA
emaSlow = ta.ema(close, slowEmaPeriod)             // calculate the slow line EMA

buyCondition = longCondition and emaFast > emaSlow and close > open and close > emaFast         // entry conditions for long positions
sellCondition = shortCondition and emaFast < emaSlow and close < open and close < emaFast       // entry conditions for short positions

if buyCondition and strategy.position_size == 0
    strategy.entry("long", strategy.long, amount)
    strategy.exit("exit_long", "long", amount, loss=loss, trail_points=trailPoints, trail_offset=trailOffset)
if sellCondition and strategy.position_size == 0
    strategy.entry("short", strategy.short, amount)
    strategy.exit("exit_short", "short", amount, loss=loss, trail_points=trailPoints, trail_offset=trailOffset)
A.It can be seen that when buyCondition is true, that is:
- Variable longCondition is true (The VuManChu Swing Free indicator sends a long position signal).
- emaFast > emaSlow (EMA long-position alignment).
- close > open (means the current BAR is positive), close > emaFast (means the closing price is above the EMA fast line).
The three conditions for going long hold.
B.When the sellCondition is true, the three conditions for making a short position hold (not repeated here).
Then we use strategy.entry function to enter and open a position in the case of an if condition judgment signal trigger, and set the strategy.exit function to stop loss and trail profit at the same time.
Complete Code
/*backtest
start: 2022-01-01 00:00:00
end: 2022-10-08 00:00:00
period: 15m
basePeriod: 5m
exchanges: [{"eid":"Futures_Binance","currency":"ETH_USDT"}]
args: [["ZPrecision",0,358374]]
*/

// This source code is subject to the terms of the Mozilla Public License 2.0 at https://mozilla.org/MPL/2.0/

// Credits to the original Script - Range Filter DonovanWall https://www.tradingview.com/script/lut7sBgG-Range-Filter-DW/
// This version is the old version of the Range Filter with less settings to tinker with

//@version=4
study(title="Range Filter - B&S Signals", shorttitle="RF - B&S Signals", overlay=true)

//-----------------------------------------------------------------------------------------------------------------------------------------------------------------
//Functions
//-----------------------------------------------------------------------------------------------------------------------------------------------------------------

//Range Size Function
rng_size(x, qty, n)=>
//    AC       = Cond_EMA(abs(x - x[1]), 1, n)
    wper      = (n*2) - 1
    avrng     = ema(abs(x - x[1]), n)
    AC = ema(avrng, wper)*qty
    rng_size = AC

//Range Filter Function
rng_filt(x, rng_, n)=>
    r          = rng_
    var rfilt  = array.new_float(2, x)
    array.set(rfilt, 1, array.get(rfilt, 0))
    if x - r > array.get(rfilt, 1)
        array.set(rfilt, 0, x - r)
    if x + r < array.get(rfilt, 1)
        array.set(rfilt, 0, x + r)
    rng_filt1 = array.get(rfilt, 0)

    hi_band   = rng_filt1 + r
    lo_band   = rng_filt1 - r
    rng_filt  = rng_filt1
    [hi_band, lo_band, rng_filt]

//-----------------------------------------------------------------------------------------------------------------------------------------------------------------
//Inputs
//-----------------------------------------------------------------------------------------------------------------------------------------------------------------

//Range Source
rng_src = input(defval=close, type=input.source, title="Swing Source")

//Range Period
rng_per = input(defval=20, minval=1, title="Swing Period")

//Range Size Inputs
rng_qty   = input(defval=3.5, minval=0.0000001, title="Swing Multiplier")

//Bar Colors
use_barcolor = input(defval=false, type=input.bool, title="Bar Colors On/Off")

//-----------------------------------------------------------------------------------------------------------------------------------------------------------------
//Definitions
//-----------------------------------------------------------------------------------------------------------------------------------------------------------------

//Range Filter Values
[h_band, l_band, filt] = rng_filt(rng_src, rng_size(rng_src, rng_qty, rng_per), rng_per)

//Direction Conditions
var fdir = 0.0
fdir    := filt > filt[1] ? 1 : filt < filt[1] ? -1 : fdir
upward   = fdir==1 ? 1 : 0
downward = fdir==-1 ? 1 : 0

//Trading Condition
longCond = rng_src > filt and rng_src > rng_src[1] and upward > 0 or rng_src > filt and rng_src < rng_src[1] and upward > 0
shortCond = rng_src < filt and rng_src < rng_src[1] and downward > 0 or rng_src < filt and rng_src > rng_src[1] and downward > 0

CondIni = 0
CondIni := longCond ? 1 : shortCond ? -1 : CondIni[1]
longCondition = longCond and CondIni[1] == -1
shortCondition = shortCond and CondIni[1] == 1

//Colors
filt_color = upward ? #05ff9b : downward ? #ff0583 : #cccccc
bar_color  = upward and (rng_src > filt) ? (rng_src > rng_src[1] ? #05ff9b : #00b36b) :
             downward and (rng_src < filt) ? (rng_src < rng_src[1] ? #ff0583 : #b8005d) : #cccccc

//-----------------------------------------------------------------------------------------------------------------------------------------------------------------
//Outputs
//-----------------------------------------------------------------------------------------------------------------------------------------------------------------

//Filter Plot
filt_plot = plot(filt, color=filt_color, transp=67, linewidth=3, title="Filter")

//Band Plots
h_band_plot = plot(h_band, color=color.new(#05ff9b, 100), title="High Band")
l_band_plot = plot(l_band, color=color.new(#ff0583, 100), title="Low Band")

//Band Fills
fill(h_band_plot, filt_plot, color=color.new(#00b36b, 92), title="High Band Fill")
fill(l_band_plot, filt_plot, color=color.new(#b8005d, 92), title="Low Band Fill")

//Bar Color
barcolor(use_barcolor ? bar_color : na)

//Plot Buy and Sell Labels
plotshape(longCondition, title = "Buy Signal", text ="BUY", textcolor = color.white, style=shape.labelup, size = size.normal, location=location.belowbar, color = color.new(color.green, 0))
plotshape(shortCondition, title = "Sell Signal", text ="SELL", textcolor = color.white, style=shape.labeldown, size = size.normal, location=location.abovebar, color = color.new(color.red, 0))

//Alerts
alertcondition(longCondition, title="Buy Alert", message = "BUY")
alertcondition(shortCondition, title="Sell Alert", message = "SELL")


// extend
fastEmaPeriod = input(50, "fastEmaPeriod")
slowEmaPeriod = input(200, "slowEmaPeriod")
loss = input(30, "loss")
trailPoints = input(30, "trailPoints")
trailOffset = input(30, "trailOffset")
amount = input(1, "amount")

emaFast = ta.ema(close, fastEmaPeriod)
emaSlow = ta.ema(close, slowEmaPeriod)

buyCondition = longCondition and emaFast > emaSlow and close > open and close > emaFast
sellCondition = shortCondition and emaFast < emaSlow and close < open and close < emaFast

if buyCondition and strategy.position_size == 0
    strategy.entry("long", strategy.long, amount)
    strategy.exit("exit_long", "long", amount, loss=loss, trail_points=trailPoints, trail_offset=trailOffset)
if sellCondition and strategy.position_size == 0
    strategy.entry("short", strategy.short, amount)
    strategy.exit("exit_short", "short", amount, loss=loss, trail_points=trailPoints, trail_offset=trailOffset)
Backtest
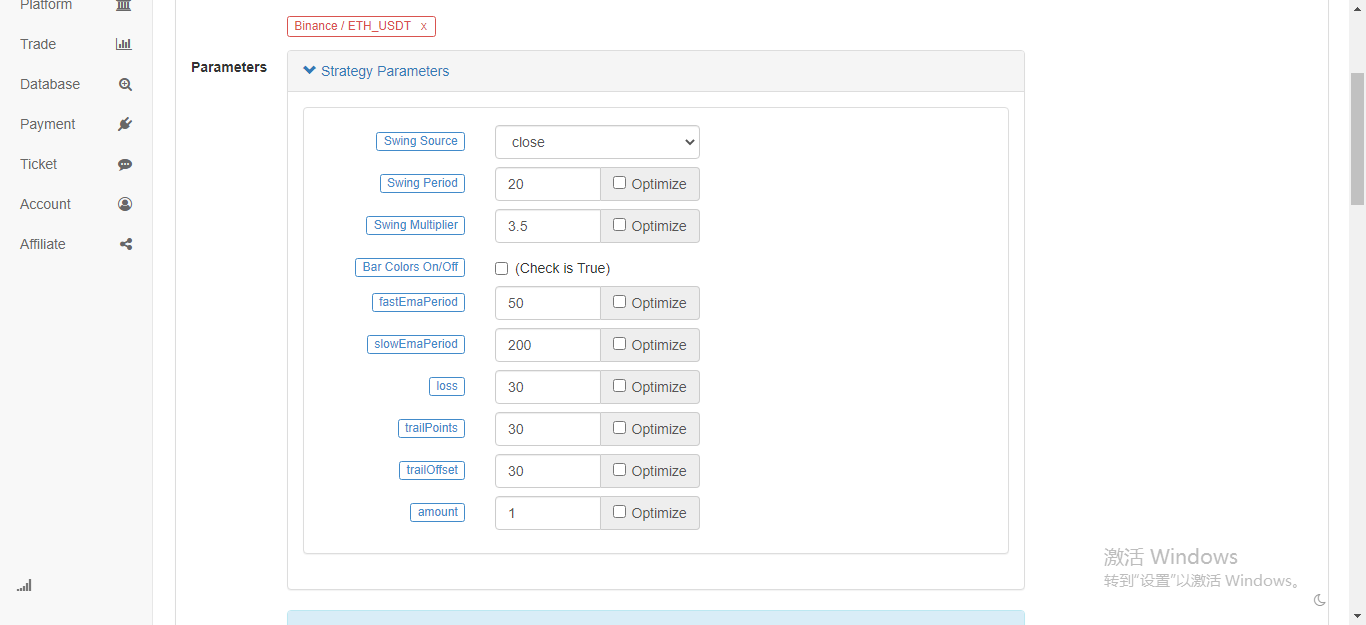
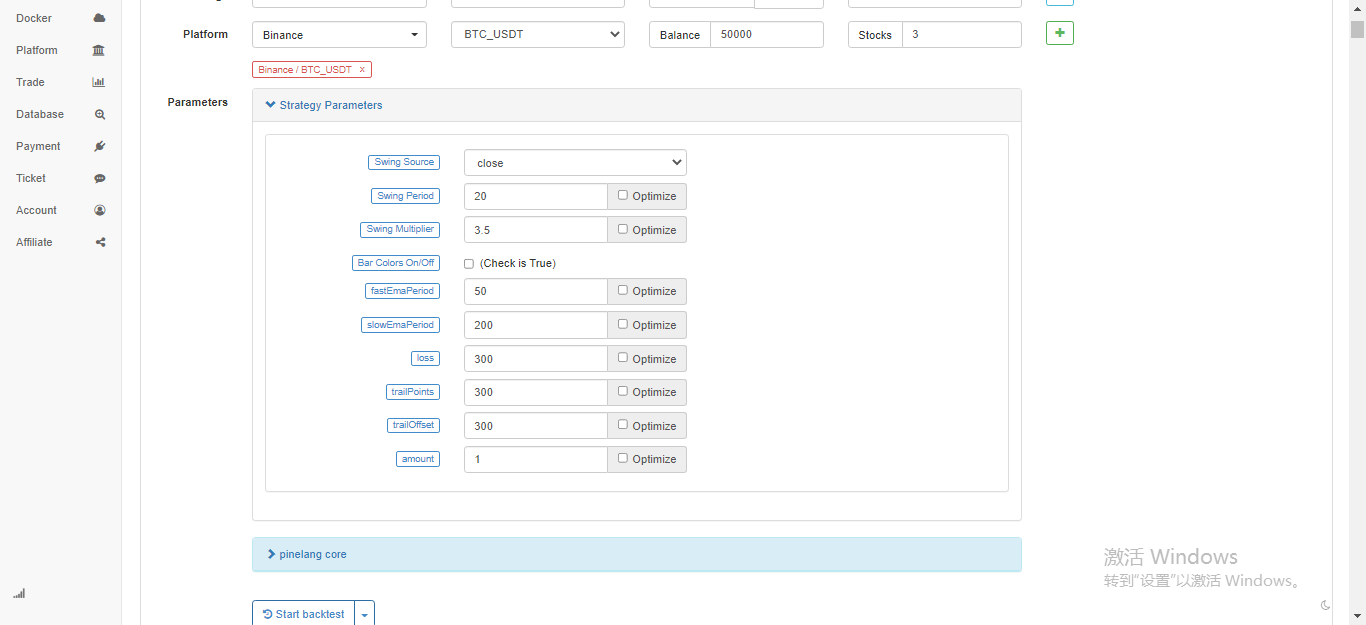
The time range of the backtest is from January 2022 to October 2022. The K-line period is 15 minutes and the closing price model is used for the backtest. Market chooses ETH of Binance_ USDT perpetual contract. The parameters are set according to the 50 periods of fast line and 200 periods of slow line in the source video. Other parameters remain unchanged by default. I set stop loss and tracking stop profit points to 30 points subjectively.
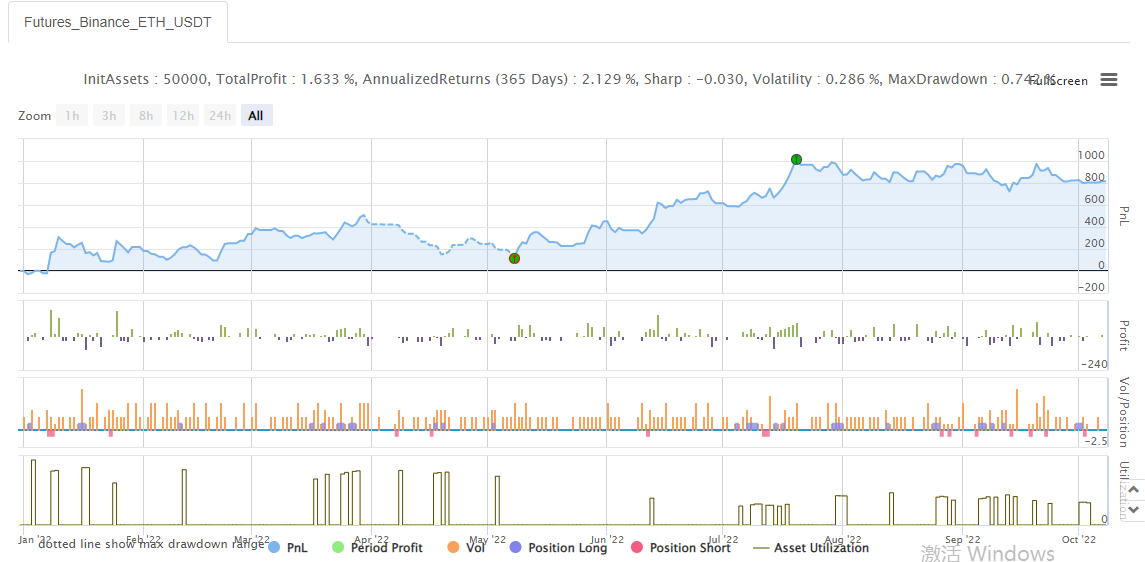
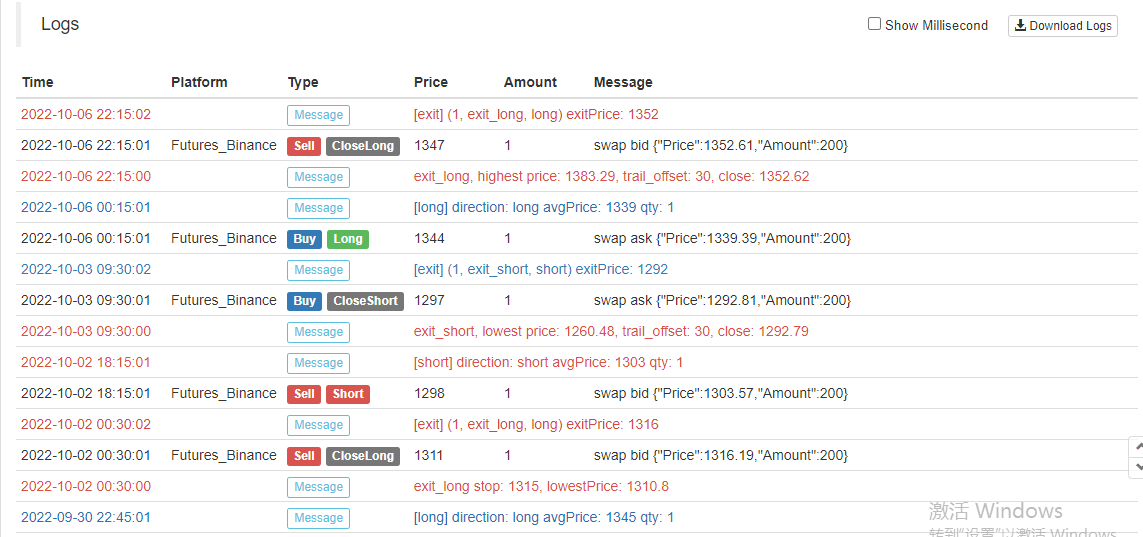
The results of the backtesting are ordinary, and it seems that the stop-loss parameters have some influence on the backtesting results. I feel that this aspect still needs to be optimized and designed. However, after the strategic signal triggers the trading, the winning rate is still OK.
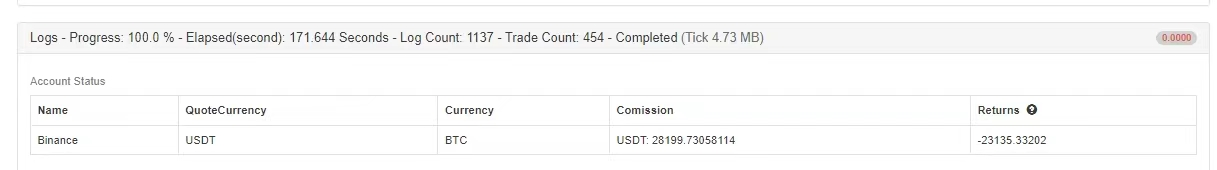
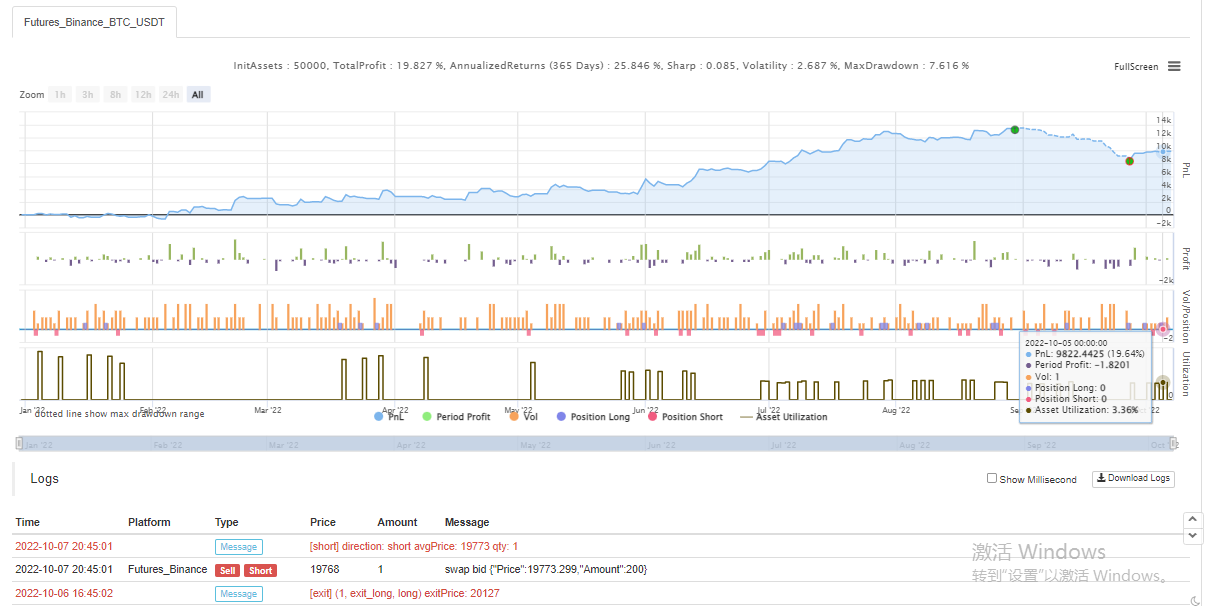
Let’s try a different BTC_USDT perpetual contract:
Result of the backtest on BTC was also very profitable:
Strategy from: https://www.fmz.com/strategy/385745
It seems that this trading method is relatively reliable for grasping the trend, you can continue to optimize the design according to this idea. In this article, we not only learned about the idea of a double moving average strategy, but also learned how to process and learn the strategy of the veterans on YouTube. OK, the above strategy code is only my brick and mortar, backtest results do not represent the specific real-bot results, the strategy code, design are for reference only. Thank you for your support, we will see you next time!