During the technical analysis of trading, traders analyze and study the stock price data as the data of normal distribution. However, the distribution of stock price data does not conform to the standard normal distribution. Fisher Transformation is a method that can transform price data into normal distribution. Fisher Transformation smooth the market data and eliminate some sharp small periodic oscillations. Trading signals can be sent by using the indicators of the current day and the previous day.
There are a lot contents about the Fisher Transformon Baidu, Zhihu, here we will not repeat.
Indicator algorithm:
- Mid-price today:
mid=(low + high) / 2 - Judge the calculation period, which can be 10 days. Calculate the highest and lowest price in the period:
lowestLow = lowest price in the period,highestHigh = highest price in the period. - Define the price change parameter (the
ratiois a constant between 0-1, for example, 0.5 or 0.33): 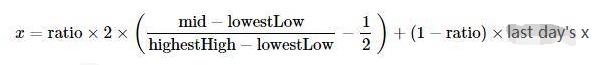
- Using the
Fishertransformation on the price change parameterx, theFisherindicator is obtained: 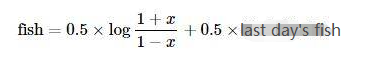
Implement the algorithm by using the JavaScript language
It is implemented step by step according to the indicator algorithm. It should be noted that the algorithm is an iterative algorithm. For preX and preFish, they were set to 0 at the beginning. For Math Log is to find the logarithm based on the natural constant e. In addition, the above algorithm did not mention the correction of x, which I almost ignored when writing:
Correct the value of x, force it to be 0.999 if it is greater than 0.99. Same for that of less than -0.99.
        if (x > 0.99) {
            x = 0.999
        } else if (x < -0.99) {
            x = -0.999
        }
The first time I saw the algorithm and indicators, I transplanted them according to the algorithm. I have not verified this implementation, and some who are interested in research can verify whether there are any errors. Thank you very much for pointing out the mistakes.
Fisher Transform indicator algorithm source code:
function getHighest(arr, period) {
    if (arr.length == 0 || arr.length - period < 0) {
        return null
    }
    var beginIndex = arr.length - period
    var ret = arr[beginIndex].High
    for (var i = 0 ; i < arr.length - 1 ; i++) {
        if (arr[i + 1].High > ret) {
            ret = arr[i + 1].High
        }
    }
    return ret
}

function getLowest(arr, period) {
    if (arr.length == 0 || arr.length - period < 0) {
        return null
    }
    var beginIndex = arr.length - period
    var ret = arr[beginIndex].Low
    for (var i = 0 ; i < arr.length - 1 ; i++) {
        if (arr[i + 1].Low < ret) {
            ret = arr[i + 1].Low
        }
    }
    return ret
}

function calcFisher(records, ratio, period) {
    var preFish = 0
    var preX = 0
    var arrFish = []
    // When the length of K-line is not enough to meet the period
    if (records.length < period) {
        for (var i = 0 ; i < records.length ; i++) {
            arrFish.push(0)
        }
        return arrFish
    }

    // traverse the K-line
    for (var i = 0 ; i < records.length ; i++) {
        var fish = 0
        var x = 0
        var bar = records[i]
        var mid = (bar.High + bar.Low) / 2
        // When the current BAR is insufficient in period calculation
        if (i < period - 1) {
            fish = 0
            preFish = 0
            arrFish.push(fish)
            continue
        }

        // Calculate the highest and lowest price in the period
        var bars = []
        for (var j = 0 ; j <= i ; j++) {
            bars.push(records[j])
        }
        var lowestLow = getLowest(bars, period)
        var highestHigh = getHighest(bars, period)

        // price change parameters
        x = ratio * 2 * ((mid - lowestLow) / (highestHigh - lowestLow) - 0.5) + (1 - ratio) * preX
        if (x > 0.99) {
            x = 0.999
        } else if (x < -0.99) {
            x = -0.999
        }
        preX = x
        fish = 0.5 * Math.log((1 + x) / (1 - x)) + 0.5 * preFish
        preFish = fish
        arrFish.push(fish)
    }
    return arrFish
}
Drawing chart
It’s easy to draw on FMZ, Strategy Square: https://www.fmz.com/square has a large number of examples on it for reference, you can search them.
var cfg = {    // The object used to initialize chart settings (i.e. chart settings)
    plotOptions: {
        candlestick: {
            color: '#d75442',  // color value
            upColor: '#6ba583' // color value
        }
    },
    title: { text: 'Fisher Transform'},     //title
    subtitle: {text: ''},     //sub-title
    plotOptions: {
        candlestick: {
        tooltip: {
            pointFormat:
            '<span style="color:{point.color}">\u25CF</span> <b> {series.name}</b><br/>' +
            'opening quotation: {point.open}<br/>' +
            'the highest: {point.high}<br/>' +
            'the lowest: {point.low}<br/>' +
            'closing quotation: {point.close}<br/>'
            }
        }
    },
    yAxis: [{
        title: {
            text: 'K-line market'
        },
        height: '70%',
        lineWidth: 1
    }, {
        title: {
            text: 'Fisher Transform'
        },
        top: '75%',
        height: '30%',
        offset: 0,
        lineWidth: 1
    }],
    series: [//series
        {
            type: 'candlestick',
            yAxis: 0,
            name: 'K-line',
            id: 'KLine',
            // Control the candle color with downward trend
            color: 'green',
            lineColor: 'green',
            // Control the candle color with upward trend
            upColor: 'red',
            upLineColor: 'red',
            data: []
        },{
            type: 'line',         // Set the current data series type as line
            yAxis: 1,             // The y-axis used as the y-axis with the index of 0 (a highcharts chart can have multiple y-axes, and the y-axis with the index of 0 is specified here)
            showInLegend: true,   //
            name: 'fish',          // Set it according to the parameter label passed in by the function
            lineWidth: 1,
            data: [],             // Data items of data series
            tooltip: {            // Tooltip
                valueDecimals: 2  // The decimal point of the value is reserved for 5 digits
            }
        },{
            type: 'line',         // Set the current data series type as line
            yAxis: 1,             // The y-axis used as the y-axis with the index of 0 (a highcharts chart can have multiple y-axes, and the y-axis with the index of 0 is specified here)
            showInLegend: true,   //
            name: 'preFish',      // Set it according to the parameter label passed in by the function
            lineWidth: 1,
            data: [],             // Data items of data series
            tooltip: {            // Tooltip
                valueDecimals: 2  // The decimal point of the value is reserved for 5 digits
            }
        }
    ]
}

var chart = Chart(cfg)
function main() {
    var ts = 0
    chart.reset()
    while (true) {
        var r = exchange.GetRecords()
        var fisher = calcFisher(r, 0.33, 10)
        if (!r || !fisher) {
            Sleep(500)
            continue
        }

        for (var i = 0; i < r.length; i++){
            if (ts == r[i].Time) {
                chart.add([0,[r[i].Time, r[i].Open, r[i].High, r[i].Low, r[i].Close], -1])
                chart.add([1,[r[i].Time, fisher[i]], -1])
                if (i - 1 >= 0) {
                    chart.add([2,[r[i].Time, fisher[i - 1]], -1])
                }
            }else if (ts < r[i].Time) {
                chart.add([0,[r[i].Time, r[i].Open, r[i].High, r[i].Low, r[i].Close]])
                chart.add([1,[r[i].Time, fisher[i]]])
                if (i - 1 >= 0) {
                    chart.add([2,[r[i].Time, fisher[i - 1]]])
                }
                ts = r[i].Time
            }
        }
    }
}
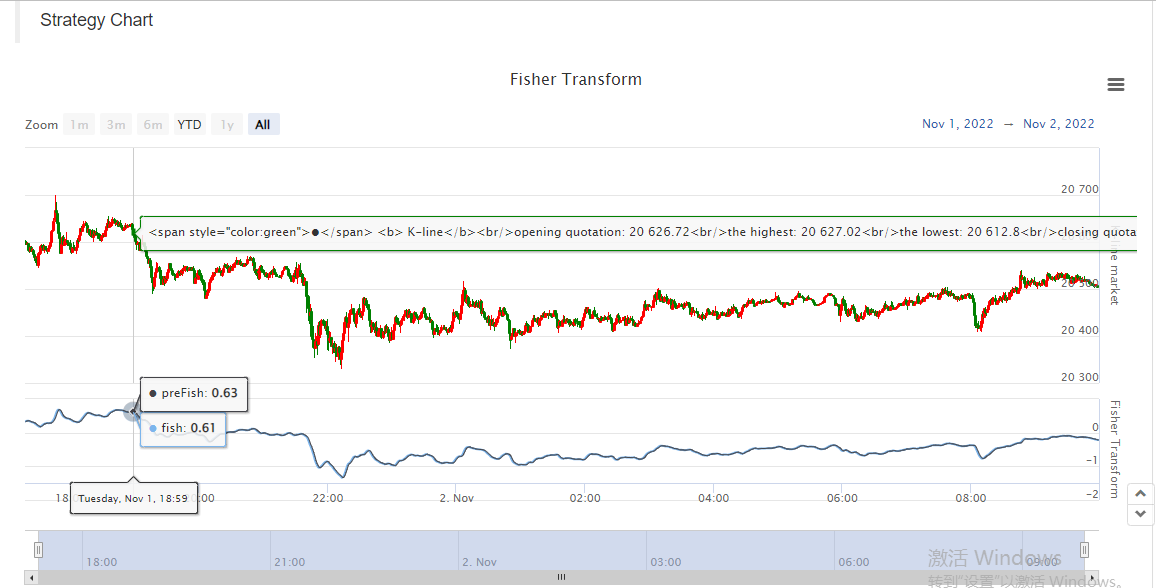
So it is very convenient to study data, display chart and design strategy on FMZ.
Here, you are welcome to leave a message.