I. Origin of the story
Mr. Ran, my good friend, has observed this indicator for a long time and recommended it to me before the New Year’s Day to discuss whether it can be converted into quantification.
It’s a pity that the procrastinator has delayed until now to help him fulfill such a wish. In fact, my understanding of algorithms has improved rapidly recently.
It is estimated that one day I will write a translator for Pine language. Everything can be python.
Well, without much nonsense, let’s introduce the legendary super trend line.
II. System introduction
In the new generation of intelligent trading system in CMC Markets, we can select “Super Trend Line” from the technical indicators to use,
We can adjust the “color and thickness” of increasing signals and decreasing signals according to our own preferences.
So what is a super trend indicator? Before understanding the super trend indicator formula, it is necessary to understand the ATR, because the super trend adopts the ATR value to calculate the indicator value.
The main algorithms are also described in the following figure:
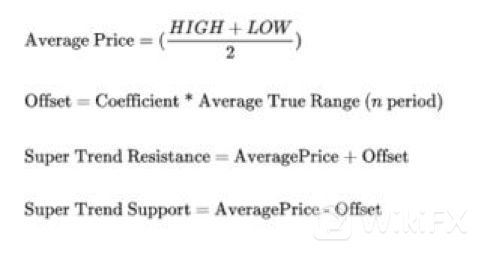
Take a brief look. It mainly describes the channel where HL2 (k-line average price) plus n times of ATR. Make a trend breakthrough.
But the article is simple. No detailed algorithm. Then I thought of the most amazing community, TradingView.
Indeed, it is indeed there.
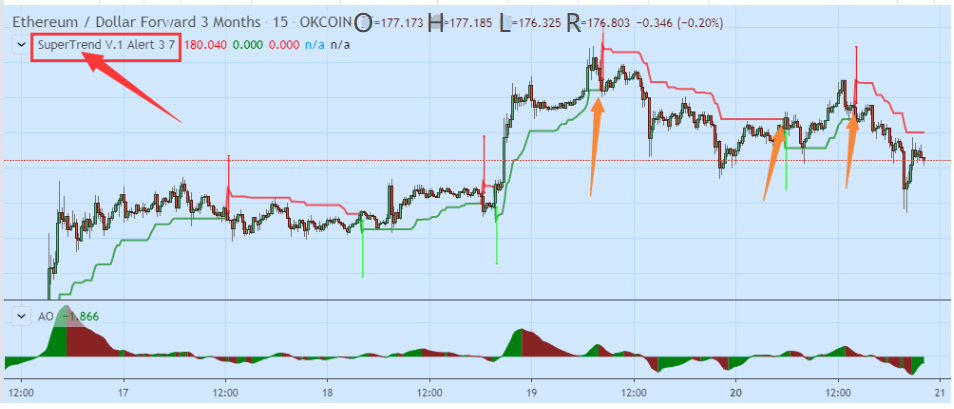
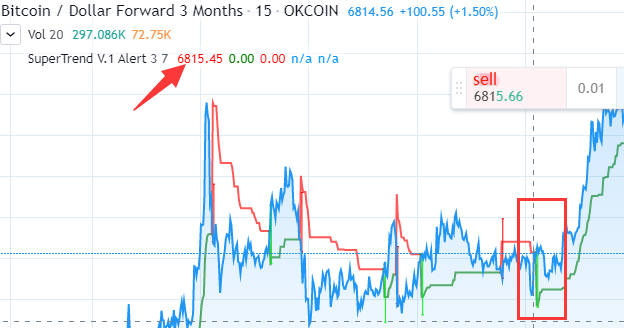
Looking at the chart, it is in line with the trend. Unfortunately, it is only an alarm signal of Alert.
III. Learning source code
The code is not too long, so let’s try to translate it. !(っ•̀ω•́)っ✎⁾⁾!
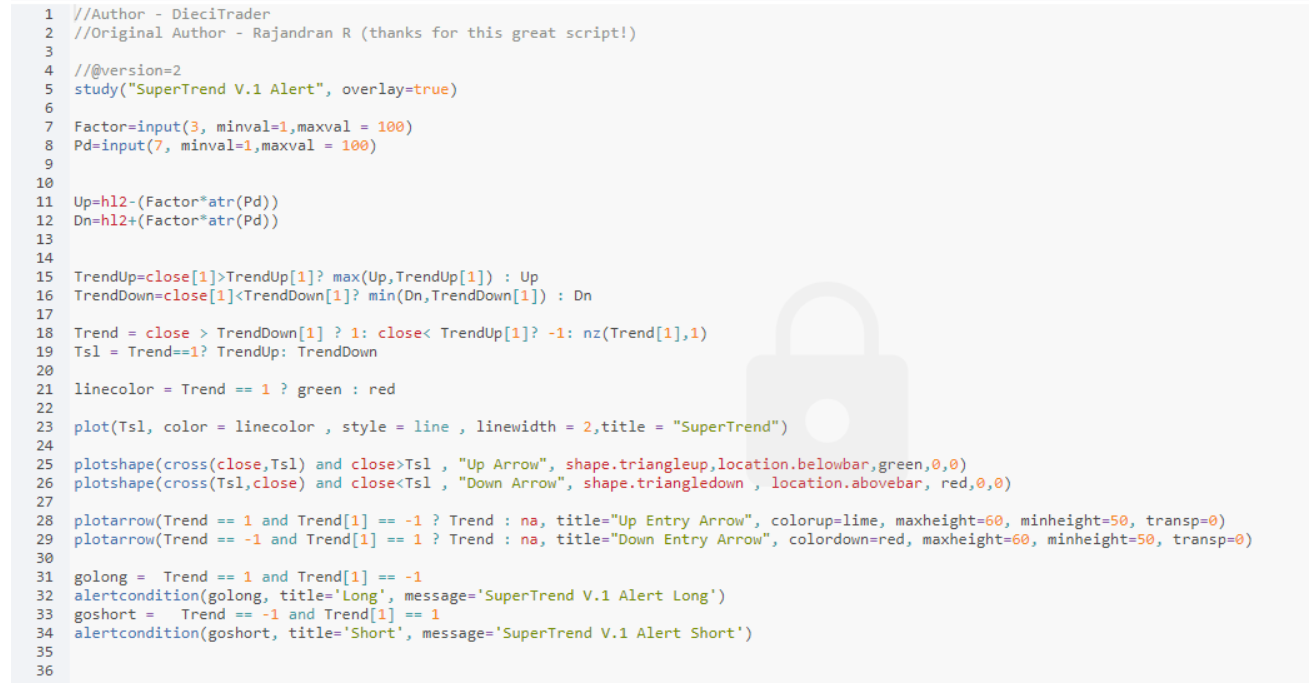
The complete pine code is as above.
VI. Code conversion
Here we create a new strategy on FMZ, name it as SuperTrend
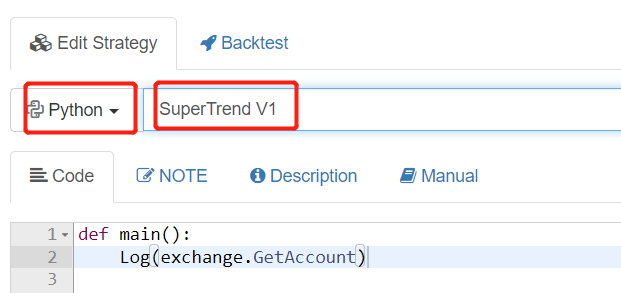
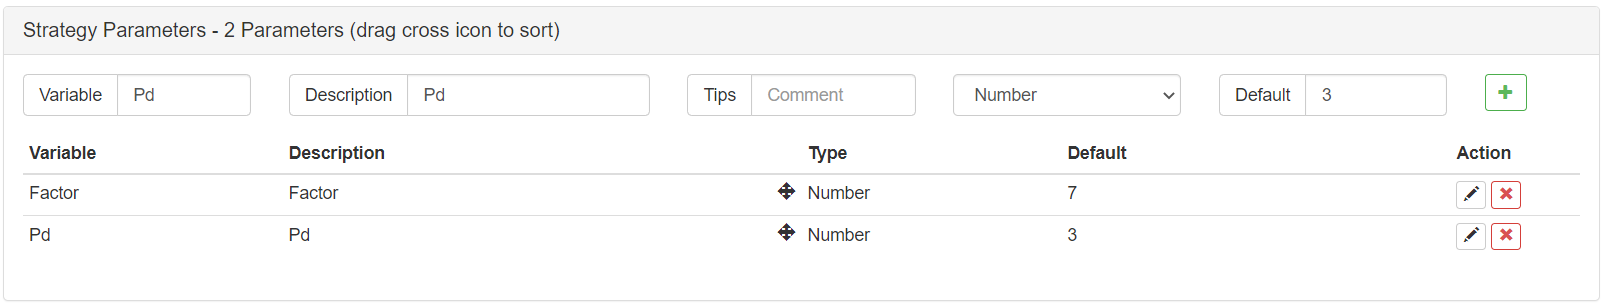
Next, we will set two parameters, Factor and Pd
In order to better simplify the code operation and facilitate understanding, we need to use python’s advanced data expansion package Pandas (https://pandas.pydata.org/)
FMZ supports this library now.
- We need to import the pandas library and time library
- In the main function, set the use of quarterly contracts (mainly for okex)
- Set a cycle doTicker() to detect once every 15 minutes.
Run the code on a 15 minute period
Then we write the main strategy in doTicker ().
import pandas as pd
import time

def main():
    exchange.SetContractType("quarter")
    preTime = 0
    Log(exchange.GetAccount())
    while True:
        records = exchange.GetRecords(PERIOD_M15)
        if records and records[-2].Time > preTime:
            preTime = records[-2].Time
            doTicker(records[:-1])
        Sleep(1000 *60)
- We need to retrieve the OHCLV of K-line, so we use GetRecords()
- We import the retrieved data to pandas M15 = pd.DataFrame(records)
- We need to modify the header label of the table. M15.columns = [‘time’,’open’,’high’,’low’,’close’,’volume’,’OpenInterest’]
In fact, it is to change the initial letters of ‘open’, ‘high’, ‘low’, and ‘close’ to lowercase, so that our later code writing does not need to change from uppercase to lowercase.
def doTicker(records):
    M15 = pd.DataFrame(records)
    M15.columns = ['time','open','high','low','close','volume','OpenInterest']
- Add a column to the data set hl2 hl2=(high+low)/2
#HL2
M15['hl2']=(M15['high']+M15['low'])/2
- Then let’s calculate ATR
Because the ATR calculation needs to import a variable length, whose value is Pd
Then we refer to the manual of MyLanguage, and the algorithm steps of the mean value of ATR real fluctuation amplitude are as follows:
TR : MAX(MAX((HIGH-LOW),ABS(REF(CLOSE,1)-HIGH)),ABS(REF(CLOSE,1)-LOW));
ATR : RMA(TR,N)
The TR value is the maximum of the following three differences
- The fluctuation between the highest price and the lowest price on the current trading day HIGH-LOW
- The fluctuation between the closing price of the previous trading day and the highest price of the current trading day REF (CLOSE, 1) – HIGH)
- The fluctuation between the closing price of the previous trading day and the lowest price of the current trading day REF (CLOSE, 1) – LOW)
So TR : MAX(MAX((HIGH-LOW),ABS(REF(CLOSE,1)-HIGH)),ABS(REF(CLOSE,1)-LOW));
In the calculation of Python
M15['prev_close']=M15['close'].shift(1)
We need to set up a prev_close to retrieve the data of close in the previous line, that is, move close right by one grid to form a new parameter
ranges= [M15['high'] - M15['low'],M15['high']-M15['prev_close'],M15['low']-M15['prev_close']]
Next, we define an intermediate variable that records an array of 3 contrastive values for TR. (HIGH-LOW) (high-prev_close) (low-prev_close)
M15['tr'] = pd.DataFrame(ranges).T.abs().max(axis=1)
We define a new column in the data set and name it as TR. The value of TR is the largest absolute value of the intermediate variable, using functions abs () and max ()
    alpha = (1.0 / length) if length > 0 else 0.5
    M15['atr']=M15['tr'].ewm(alpha=alpha, min_periods=length).mean()
Finally, we need to calculate the value of ATR, ATR: RMA (TR, N). It is found that the RMA algorithm is a fixed value variant of the EMA algorithm actually.
N is the variable we import. The default parameter of ATR is 14. Here we import the reciprocal of alpha=length.
===
Then the ewm algorithm is used to calculate the ema
The complete ATR calculation process is as follows
    #ATR(PD)
    length=Pd
    M15['prev_close']=M15['close'].shift(1)
    ranges= [M15['high'] - M15['low'],M15['high']-M15['prev_close'],M15['low']-M15['prev_close']]
    M15['tr'] = pd.DataFrame(ranges).T.abs().max(axis=1)
    alpha = (1.0 / length) if length > 0 else 0.5
    M15['atr']=M15['tr'].ewm(alpha=alpha, min_periods=length).mean()
9 Start calculating Up and Dn
    M15['Up']=M15['hl2']-(Factor*M15['atr'])
    M15['Dn']=M15['hl2']+(Factor*M15['atr'])
Up=hl2 -(Factor * atr)
Dn=hl2 +(Factor * atr)
Isn’t that simple?
Here is the core code section of the lines 15-21 from TV
TrendUp=close[1]>TrendUp[1]? max(Up,TrendUp[1]) : Up
TrendDown=close[1]<TrendDown[1]? min(Dn,TrendDown[1]) : Dn

Trend = close > TrendDown[1] ? 1: close< TrendUp[1]? -1: nz(Trend[1],1)
Tsl = Trend==1? TrendUp: TrendDown

linecolor = Trend == 1 ? green : red
The main point of this paragraph is to express that,
If it is in the bullish stage, (the lower line) TrendUp=max (Up, TrendUp [1])
If it is in the falling stage, (the upper line) TrendDown=min (Dn, TrendDown [1])
That is to say, in a trend, the ATR value has been using a technology similar to the Bandit Bollinger strategy.
Keep narrowing the other side of the channel
Here, each calculation of TrendUp and TrendDown requires self iteration.
That is, each step should be calculated according to the previous step.
Therefore, the data set should be iterated in the loop.
First, we create new fields TrendUp, TrendDown, Trend, linecolor for the data set. And give them an initial value
Then we use the grammar fillna (0) to fill the data with null value in the previously calculated result with 0
    M15['TrendUp']=0.0
    M15['TrendDown']=0.0
    M15['Trend']=1
    M15['Tsl']=0.0
    M15['linecolor']='Homily'
    M15 = M15.fillna(0)
Enable a for loop
Using python ternary operation in the loop
for x in range(len(M15)):
Calculate the TrendUp
TrendUp = MAX(Up,TrendUp[-1]) if close[-1]>TrendUp[-1] else Up
It roughly means that if the previous close>previous TrendUp is true, the maximum value between Up and the previous TrendUp will be taken; if not, the Up value will be taken and passed to the current TrendUp
M15['TrendUp'].values[x] = max(M15['Up'].values[x],M15['TrendUp'].values[x-1]) if (M15['close'].values[x-1]>M15['TrendUp'].values[x-1]) else M15['Up'].values[x]
Similarly, calculate the TrendDown
TrendDown=min(Dn,TrendDown[-1]) if close[-1]<TrendDown[-1] else Dn
It roughly means that if the previous close<the previous TrendDown is true, the minimum value between Dn and the previous TrendDown will be taken; if not, the Dn value will be taken and passed to the current TrendDown
M15['TrendDown'].values[x] = min(M15['Dn'].values[x],M15['TrendDown'].values[x-1]) if (M15['close'].values[x-1]<M15['TrendDown'].values[x-1]) else M15['Dn'].values[x]
The following is the flag for calculating the control direction. I simplified the pseudo code
Trend= 1 if (close > TrendDown[-1]) else (x)
x = -1 if (close< TrendUp[-1]) else Trend[-1]
The meaning is that if the closing price>the previous TrendDown, take the value of 1 (bullish). If not, take the value of x
If the closing price is less than the previous TrendUp, take the value of -1 (bearish). If not, take the previous Trend (meaning unchanged)
To translate into image language is that a breakout of the upper track transition flag for bullish; and a breakout of the lower track transition flag for bearish. Other time will not change.
M15['Tsl'].values[x] = M15['TrendUp'].values[x] if (M15['Trend'].values[x]==1) else M15['TrendDown'].values[x]
Calculate Tsl and Linecolor
Tsl= rendUp if (Trend==1) else TrendDown
Tsl is the value used to represent SuperTrend on the image. It means to mark the down track on the image when we are in bullish, and mark the upper track on the image when we are in bearish.
linecolor= ‘green’ if (Trend==1) else ‘red’
The meaning of linecolor is to mark the green line if we are in bullish, and mark the empty color if we are in bearish (mainly for the purpose of Tradeview display)
        M15['Tsl'].values[x] = M15['TrendUp'].values[x] if  (M15['Trend'].values[x]==1) else M15['TrendDown'].values[x]
        M15['linecolor'].values[x]= 'green' if ( M15['Trend'].values[x]==1) else  'red'
The next 23-30 lines of code are mainly plot drawings, which are not explained here.
Finally, there are 2 lines of code to control the buying and selling signal
In Tradeview, it means that the signal is given after reversing the Flag
Convert the conditional statement to python.
If the last Trend flag changes from -1 to 1, it means that the upper resistance is exceeded and open long position.
If the last Trend flag changes from 1 to -1, it means that the down support is exceeded and open short position.
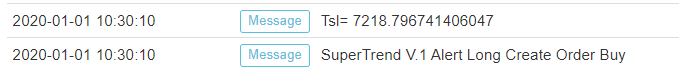
    if(M15['Trend'].values[-1] == 1 and M15['Trend'].values[-2] == -1):
        Log('SuperTrend V.1 Alert Long',"Create Order Buy)
    if(M15['Trend'].values[-1] == -1 and M15['Trend'].values[-2] == 1):
        Log('SuperTrend V.1 Alert Long',"Create Order Sell)
The complete code is as follows:
    M15['TrendUp']=0.0
    M15['TrendDown']=0.0
    M15['Trend']=1
    M15['Tsl']=0.0
    M15['linecolor']='Homily'
    M15 = M15.fillna(0)

    for x in range(len(M15)):
        M15['TrendUp'].values[x] = max(M15['Up'].values[x],M15['TrendUp'].values[x-1]) if (M15['close'].values[x-1]>M15['TrendUp'].values[x-1]) else M15['Up'].values[x]
        M15['TrendDown'].values[x] = min(M15['Dn'].values[x],M15['TrendDown'].values[x-1]) if (M15['close'].values[x-1]<M15['TrendDown'].values[x-1]) else M15['Dn'].values[x]
        M15['Trend'].values[x] = 1 if (M15['close'].values[x] > M15['TrendDown'].values[x-1]) else ( -1 if (M15['close'].values[x]< M15['TrendUp'].values[x-1])else M15['Trend'].values[x-1] )
        M15['Tsl'].values[x] = M15['TrendUp'].values[x] if  (M15['Trend'].values[x]==1) else M15['TrendDown'].values[x]
        M15['linecolor'].values[x]= 'green' if ( M15['Trend'].values[x]==1) else  'red'

    if(M15['Trend'].values[-1] == 1 and M15['Trend'].values[-2] == -1):
        Log('SuperTrend V.1 Alert Long',"Create Order Buy)
        Log('Tsl=',Tsl)
    if(M15['Trend'].values[-1] == -1 and M15['Trend'].values[-2] == 1):
        Log('SuperTrend V.1 Alert Long',"Create Order Sell)
        Log('Tsl=',Tsl)
V. Complete code
I adjusted the overall code structure.
And I merged the order instructions related to go long and go short into the strategy.
Here is the complete code:
'''backtest
start: 2019-05-01 00:00:00
end: 2020-04-21 00:00:00
period: 15m
exchanges: [{"eid":"Futures_OKCoin","currency":"BTC_USD"}]
'''

import pandas as pd
import time

def main():
    exchange.SetContractType("quarter")
    preTime = 0
    Log(exchange.GetAccount())
    while True:
        records = exchange.GetRecords(PERIOD_M15)
        if records and records[-2].Time > preTime:
            preTime = records[-2].Time
            doTicker(records[:-1])
        Sleep(1000 *60)


def doTicker(records):
    #Log('onTick',exchange.GetTicker())
    M15 = pd.DataFrame(records)

    #Factor=3
    #Pd=7

    M15.columns = ['time','open','high','low','close','volume','OpenInterest']

    #HL2
    M15['hl2']=(M15['high']+M15['low'])/2

    #ATR(PD)
    length=Pd
    M15['prev_close']=M15['close'].shift(1)
    ranges= [M15['high'] - M15['low'],M15['high']-M15['prev_close'],M15['low']-M15['prev_close']]
    M15['tr'] = pd.DataFrame(ranges).T.abs().max(axis=1)
    alpha = (1.0 / length) if length > 0 else 0.5
    M15['atr']=M15['tr'].ewm(alpha=alpha, min_periods=length).mean()


    M15['Up']=M15['hl2']-(Factor*M15['atr'])
    M15['Dn']=M15['hl2']+(Factor*M15['atr'])

    M15['TrendUp']=0.0
    M15['TrendDown']=0.0
    M15['Trend']=1
    M15['Tsl']=0.0
    M15['linecolor']='Homily'
    M15 = M15.fillna(0)

    for x in range(len(M15)):
        M15['TrendUp'].values[x] = max(M15['Up'].values[x],M15['TrendUp'].values[x-1]) if (M15['close'].values[x-1]>M15['TrendUp'].values[x-1]) else M15['Up'].values[x]
        M15['TrendDown'].values[x] = min(M15['Dn'].values[x],M15['TrendDown'].values[x-1]) if (M15['close'].values[x-1]<M15['TrendDown'].values[x-1]) else M15['Dn'].values[x]
        M15['Trend'].values[x] = 1 if (M15['close'].values[x] > M15['TrendDown'].values[x-1]) else ( -1 if (M15['close'].values[x]< M15['TrendUp'].values[x-1])else M15['Trend'].values[x-1] )
        M15['Tsl'].values[x] = M15['TrendUp'].values[x] if  (M15['Trend'].values[x]==1) else M15['TrendDown'].values[x]
        M15['linecolor'].values[x]= 'Long' if ( M15['Trend'].values[x]==1) else  'Short'


    linecolor=M15['linecolor'].values[-2]
    close=M15['close'].values[-2]
    Tsl=M15['Tsl'].values[-2]


    if(M15['Trend'].values[-1] == 1 and M15['Trend'].values[-2] == -1):

        Log('SuperTrend V.1 Alert Long','Create Order Buy')
        Log('Tsl=',Tsl)
        position = exchange.GetPosition()
        if len(position) > 0:
            Amount=position[0]["Amount"]
            exchange.SetDirection("closesell")
            exchange.Buy(_C(exchange.GetTicker).Sell*1.01, Amount);

        exchange.SetDirection("buy")
        exchange.Buy(_C(exchange.GetTicker).Sell*1.01, vol);

    if(M15['Trend'].values[-1] == -1 and M15['Trend'].values[-2] == 1):
        Log('SuperTrend V.1 Alert Long','Create Order Sell')
        Log('Tsl=',Tsl)
        position = exchange.GetPosition()
        if len(position) > 0:
            Amount=position[0]["Amount"]
            exchange.SetDirection("closebuy")
            exchange.Sell(_C(exchange.GetTicker).Buy*0.99,Amount);
        exchange.SetDirection("sell")
        exchange.Sell(_C(exchange.GetTicker).Buy*0.99, vol*2);
Public strategy address: https://www.fmz.com/strategy/200625
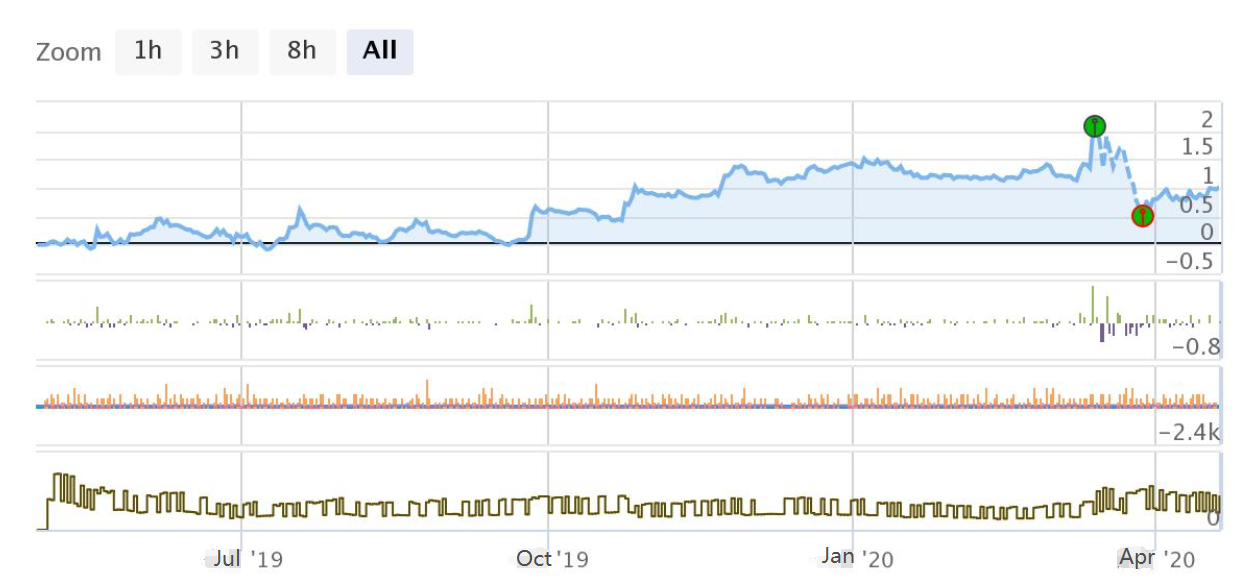
VI. Backtesting and summary
We selected the data of the past year for backtesting.
We use the OKEX quarterly contract for a 15-minute period.
The set parameters are:
Factor=3
Pd=45
Vol=100 (100 contracts for each order)
The annualized return is about 33%.
Generally speaking, the withdrawal is not very much,
The sharp decrease of 312 had a relatively great impact on the system,
If there is no 312, the returns should be better.
VII. Write at the end
SuperTrend is a very good trading system
The main principle of SuperTrend system is to adopt ATR channel breakthrough strategy (similar to Kent channel)
However, its change is mainly due to the use of the narrowing strategy of the Bandit Bollinger, or the reverse of the Donchian principle.
In the market operation, the upper and lower channels are continuously narrowed.
In order to achieve the operation of channel breakthrough steering. (Once the channel breaks through, the upper and lower tracks will return to the initial value)
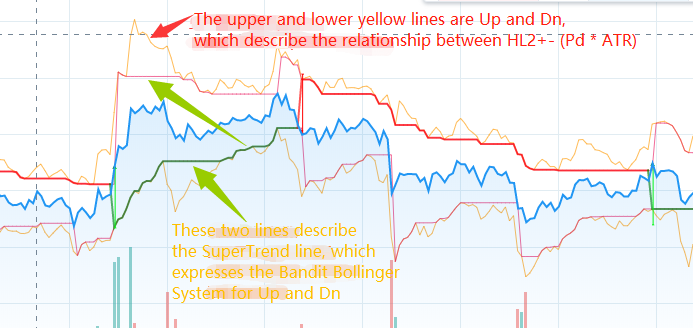
I plot up, dn, TrendUp and TrendDn separately on the TradeView,
which makes it easier to better understand the strategy.
See it clear at a glance:
In addition, there is a version of js on github. I am not good at js, but it seems that there is something wrong with the if statement.
The address: https://github.com/Dodo33/gekko-supertrend-strategy/blob/master/Supertrend.js
Finally, I tracked down the original version.
It was published on May 29, 2013
The author is Rajandran R
C++code was published on the Mt4 forum: https://www.mql5.com/en/code/viewcode/10851/128437/Non_Repainting_SuperTrend.mq4
I have roughly understood the meaning of C++, and I will rewrite it when I have the opportunity.
I hope you can learn the essence from it.
It’s difficult.~!