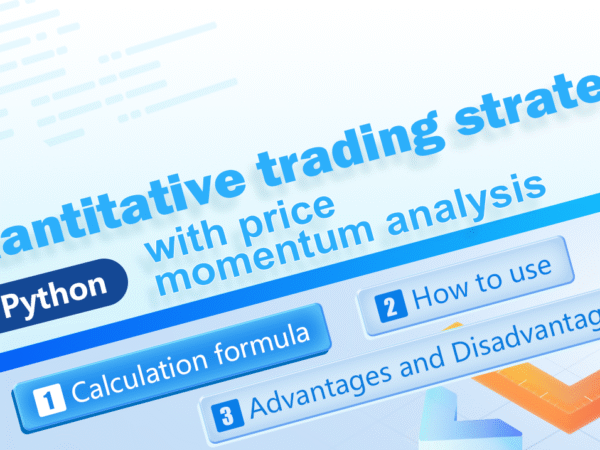
Introduction to price momentum trading strategy
Momentum trading strategy analyzes the comparison of long and short position forces through the relationship between the opening price, the highest price, and the lowest price over a certain period of time, which indirectly enables us to understand the current distribution of long and short forces in the market. The analysis of price fluctuations is used to track future price movements.
The price momentum analysis has been widely used in traditional manual speculative orders, especially in determining the unilateral trend in the day. The old cliché, what is to take advantage of the situation. The best quantification of the situation is the quantification of the strength comparison between the long and short position sides. The price momentum analysis is one of the best indicators.
This paper will use this strategy to develop an automated spot trading program for digital currency on the Huobi.
Calculation formula of price momentum
AR = [Sum of all (High-Open) for N days / Sum of all (Open-Low) for N days] * 100
Among them:
- N: The statistical window of the daily time cycle is generally 30 days by default, because the effective trading day of a month is about 30 days (digital currency 24/7 transactions, which may be conservative)
- High: the highest price in a single day
- Open: opening price of a single day
- Low: the lowest price in a single day
How to use price momentum
The price momentum reflects the position of the opening price between the highest price and the lowest price for a period of time. This position is the basis for us to judge the strength of both parties pulling together.
- We assume that this value is about 100. If it is more than 100, the long position force begins to increase. If it is less than 100, the short position force begins to gather.
- When the AR value increases, it means that the market is active and popular, and the long positions are soaring all the way, but if the price is too high, it means that the price has entered the overbought area, and you should choose time to close the position. There is no specific standard for the height of AR value. Generally, when the AR value rises to about 120, the price is likely to fall back.
- When the AR value decreases, it indicates that the market is declining, and the short position is in full swing, which requires the efforts of long positions. If the AR value is too low, it indicates that the price may have fallen into the oversold area, and you can consider waiting for the opportunity to go long. Generally, when the AR value falls below 50, the price will stop falling and rise at any time.
Note: The above numbers are all default values and are not truth formulas. In the process of real trading, we should adjust this range to adapt to the current market state as the market changes.
Implementing a quantitative trading strategy for price momentum in Python
As usual, we open FMZ.COM, log in to our account, click on Dashboard, and deploy the docker and robot.
Please refer to my previous article on how to deploy a docker and robot: https://www.fmz.com/bbs-topic/9864.
Readers who want to purchase their own cloud computing server to deploy dockers can refer to this article: https://www.fmz.com/digest-topic/5711.
Next, we click on the Strategy library in the left column and click on Add strategy.
Remember to select the programming language as Python in the upper right corner of the strategy editing page, as shown in the figure:
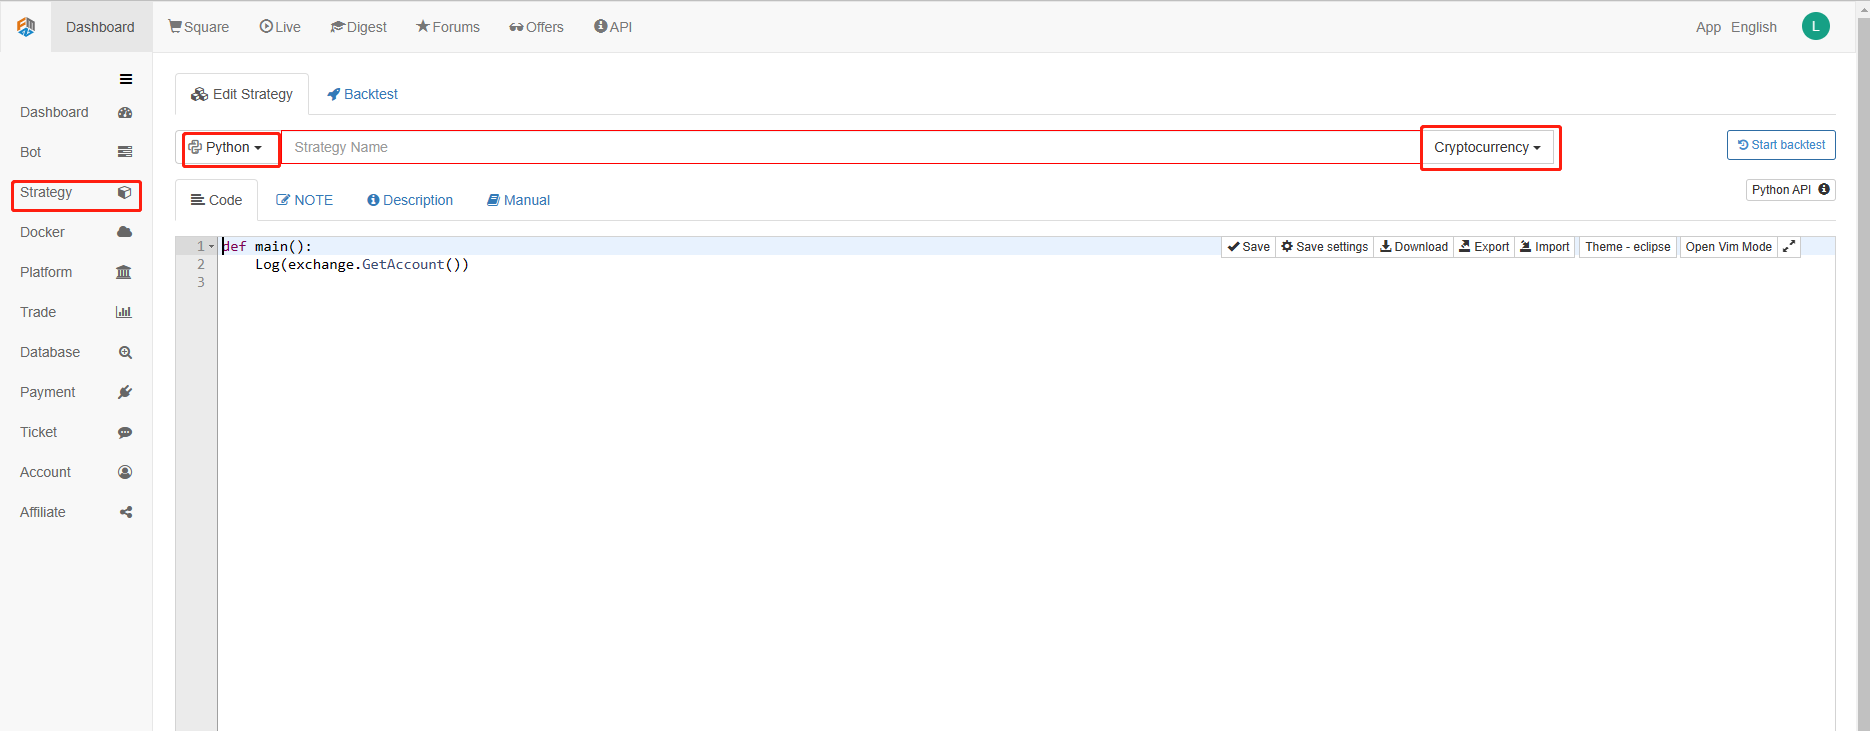
Next, we will write the Python code into the code editing page. The following code has very detailed line-by-line comments, you readers can take your time to understand. More importantly, although this strategy is written based on spot trading, the extensibility of the following code also takes into account futures trading. Interested readers can try to rewrite the following code into futures trading. The logic of the strategy itself is universal. On the FMZ Quant platform, we have prepared the API interfaces of the major spot and futures exchanges for you, so the rewriting will be very easy and convenient.
We will use the Bitcoin spot of Huobi as the trading target and start to implement this strategy:
import types # Import the Types module library, which is designed to handle the various data types that will be used in the code.
def main(): # The main function, where the strategy logic begins.
    IDLE = 0 # It is used to mark the position status, which can be understood as 0, that is, idle status, i.e. short position status.
    LONG = 1 # Long positions
    SHORT = 2 # Short position. Note that this strategy is applied to the spot market, so there is no short opening or position. This is written here to facilitate understanding of the strategy and future expansion (such as extending to the futures market).
    state = IDLE # Variables that mark the status of a position
    while True: # Enter the loop
        r = exchange.GetRecords() # GetRecords is the official API of the FMZ Quant Platform, for detailed usage please refer to: https://www.fmz.com/api.
        if len(r) <= 1: # Judge whether the K-line is larger than one, that is, whether it is currently in the open state, or it may enter an endless loop. Here, it is also convenient for readers to expand, and the trend state of a larger K-line period is more stable.
           Log("The number of bars is not enough, wait for the next bar...") # Output logs
           continue # Python loop control statement, continuing with the next part of the loop.

        # Begin quantitative analysis of price momentum
        ar = sum(r.High - r.Open) / sum(r.Open - r.Low) * 100 # Calculation formula

        account = _C(exchange.GetAccount) # Get account information, _C is also the official API of the FMZ Quant platform, for usage, please refer to: https://www.fmz.com/api.

        if ar < 95 and (state == IDLE or state == SHORT) :  # If the AR value is less than the oversold line and the account has funds, then buy all positions.

           if account["Balance"] > 50:
                exchange.Buy(-1, account["Balance"] * 0.9) # Buy all positions of the market order
                state = LONG # Change the position status to LONG

        elif ar > 80 and (state == IDLE or state == LONG):  # If the AR value is greater than the overbought line and the account has a position, sell the whole position.

           if account["Stocks"] > 0.01:
                exchange.Sell(-1, account["Stocks"] * 0.9) # Sell all positions market order
                state = SHORT # Change the position status to SHORT

        LogStatus(_D(), exchange.GetAccount() , state) # Update log information
Strategy backtesting
After writing the strategy, the first thing we need to do is to test it to see how it behaves in the historical data. But please note that the result of the backtest is not equal to the prediction of the future. The backtest can only be used as a reference to consider the effectiveness of our strategy. Once the market changes and the strategy begins to have great losses, we should find the problem in time, and then change the strategy to adapt to the new market environment, such as the threshold mentioned above. If the strategy has a loss greater than 10%, we should stop the operation of the strategy immediately, and then find the problem. We can start with adjusting the threshold.
Click backtest in the strategy editing page. On the backtest page, the adjustment of parameters can be carried out conveniently and quickly according to different needs. Especially for the strategy with complex logic and many parameters, no need to go back to the source code page and modify it one by one.
The backtest time is the latest month. Click to add the Huobi spot exchange and BTC trading target.

Backtesting results:

We can see that the strategy performed well in the backtest of this month.
Advantages and disadvantages of price momentum strategy
- Advantages
Compared with some other traditional technical indicators, the advantage of price momentum is that it does not use a single opening price or closing price, but introduces the highest and lowest prices. They are compared dynamically, making the market information more comprehensive, responsive and macro through intra-day price fluctuations. - Disadvantages
Use the price momentum value independently to judge whether the price is too high or low, to judge long/short, it is likely to get off early in a wave of major trends, or to bottom fishing early in a wave of major down market. In general, the strategy is still a shock effectiveness strategy.
The threshold setting of the strategy also needs to be determined according to the characteristics of the trading object. The price fluctuation of the digital currency market is relatively large, and the trading volume is huge, especially on the mainstream currencies such as Bitcoin, and there is no limit on the rise and fall, so the threshold value is higher than that of the traditional stock market. The 80 oversold line is usually difficult to touch, and there are few buying signals; While the overbought line of 170 is often below the threshold, the selling signal is triggered frequently. This will cause the strategy to be in short position for most of the time, and the fund utilization become very low. For example, since January this year, the price of Bitcoin has risen from 3500 to nearly 13000 in a wave of bull market. The threshold value has crossed the 170 line very early and has been high since then. If we sell according to the traditional 170 overbought line, we will get off at the price of 5000, and there will be no opening signal after that, making only a very small portion of profits in a wave of bull market.
Therefore, there has never been any Holy Grail trading strategy in the market. You cannot always make profits without backtesting and debugging. Like subjective traders, we quantitative traders end up with the same goal in different ways. We need to adapt to local conditions according to the changes of the market and respond to the changes of the market. When the strategy is ineffective, we need to adjust it in time.
If you have any questions, you can leave a message at https://www.fmz.com/bbs, whether it is about the strategy or the technology of the platform, the FMZ Quant platform has professionals ready to answer your questions.
