Welcome all traders to my channel, I am a Quant Developer, specializing in full-stack development of CTA, HFT & Arbitrage trading strategies.
Thanks to the FMZ Platform, I will share more content related to quantitative development and work together with all traders to maintain the prosperity of the quant community.
Today, I will bring you an upgrade and transformation of the PSY (Psychological Line) factor. We will show how to add more market information from a simple factor perspective, step by step transform it, and ultimately turn it into a powerful factor with explanatory and logical strength!!! Of course, after reading this article, you can incorporate the transformed PSY factor into your own library of factors as a powerful weapon~
PART1 Initial PSY Factor
The PSY Factor (Psychological Line) is a technical analysis indicator used to measure the impact of market participants’ emotions on price trends. It is an emotional index for studying investors’ psychological fluctuations in response to market ups and downs, and it’s a type of energy and rise-fall indicator. It has certain reference significance for judging short-term market trends.
The PSY factor was first proposed by Dr. Wang Yawei in 1991. He believed that the psychological changes in the market are closely related to price trends, and quantified these psychological changes into the PSY factor. As an indicator for analyzing market fluctuations, the PSY factor calculates the total bullish and bearish forces within N K-lines over time to describe whether the current market is strong or weak, or if it’s in an overbought or oversold state. It mainly measures investors’ psychological endurance by calculating how many rising K-lines there are within N K-lines, providing a reference for investors’ buying and selling operations.
The PSY factor is based on the number of days the closing price rises or falls over a period of time. Its calculation method is very simple, and the calculation formula is as follows: PSY=(Number of rising days within N K-lines/N)*100. Here, N period represents the selected calculation period, which can be several days, weeks or months etc. The number of rising days refers to the number of trading days with rising prices within the N period. The initial PSY factor function source code based on FMZ platform:
functioncalculatePSY(data, n) {
  let count = 0;
  for (let i = data.length - n; i < data.length; i++) {
    if (data[i] > data[i - 1]) {
      count++;
    }
  }
  return (count / n) * 100;
}

// Usage examplelet closePrices = [10, 12, 13, 11, 14, 15, 16, 17, 18, 20];
let nPeriod = 5;
let psyFactor = calculatePSY(closePrices, nPeriod);
Log(psyFactor);
PART2 Enhance PSY Factor (PSY+PRICE)
The essence of the PSY factor is a momentum factor, which measures the comparison of the root numbers of rising and falling forces over a period of time, with the aim to find out which side has greater strength in the past. However, upon careful observation, it can be found that the PSY factor only considers whether the BAR line is rising or falling, lacking a description of BAR itself and unable to judge the intensity of market conditions, resulting in situations — Of the last 6 K-lines, 3 were down and 3 were up, and the value of 50, as constructed by the initial PSY factor, it does not discern the strength of the long and short forces in the last 6 K-lines.
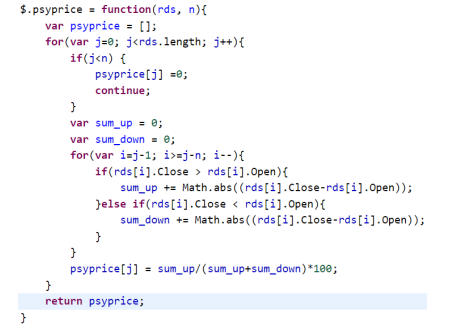
As mentioned above, the uniqueness of a large bullish K-line is not reflected in the PSY indicator, it’s merely treated as an upward line with no difference from the previous small bearish K-line. This is where the problem lies, as the number of rises and falls cannot fully describe the magnitude and direction of price changes. Therefore, our first improvement idea was to weight each BAR’s price change Abs(C-C[1]) to reflect the magnitude of rise and fall forces. The source code for initial PSY+PRICE factor function based on FMZ platform:
PART3 Final PSY Factor (PSY+PRICE+VOL)
After the modification in the previous step, the transformed PSY factor can better reflect the strength and weakness over a period of time. However, it cannot distinguish well if the rise and fall range is basically consistent during that period. At this point, we continue to add trading volume factors. In momentum effect, increased volume represents a more active market, and increased volume situation can better confirm momentum direction. As shown in the figure below:
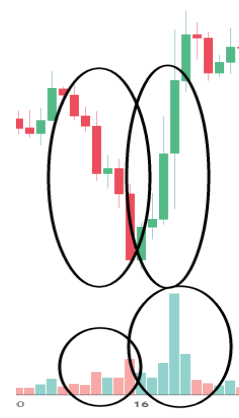
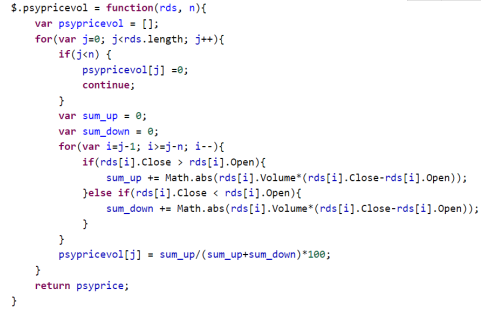
Over the past period of time, the magnitude of the rise and the fall were basically the same, but the volume in the rise far exceeded the volume in the fall, reflecting the superior upward force. Therefore, in the final PSY factor, we continue to add the volume factor weighting, VOLUME*Abs(C-C[1]), based on the initial PSY+PRICE factor function source code of FMZ platform:
PART4 Construction of PSY Factor Trading Signals
Based on the final PSY+PRICE+VOL factor constructed in the previous article, we attempt to propose several constructions of momentum signals as follows:
- psy[0] > X (Over a period of time in the past, the ratio of multiple forces was greater than X value.)
- psy[0] < Y (Over a period of time in the past, the ratio of multiple forces was less than Y value.)
- psy[0] > psy[1] or psy[0] > psyma (Over the past period of time, the ratio of various forces has increased.)
- psy[0] < psy[1] or psy[0] < psyma (Over a period of time, the ratio of multiple forces has decreased.)
We design a simple momentum strategy with signals to detect factors.
- Go long: PSY[0] > 70; Close long position: PSY[0] < 30;
- Go short: PSY[0] < 30; Close short position: PSY[0] > 70;
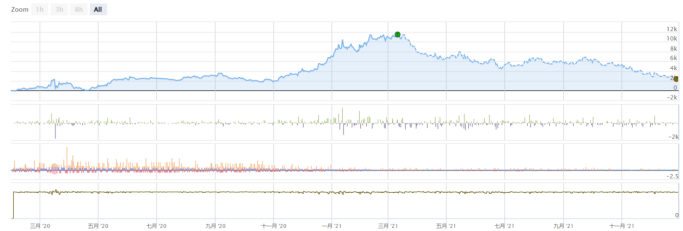
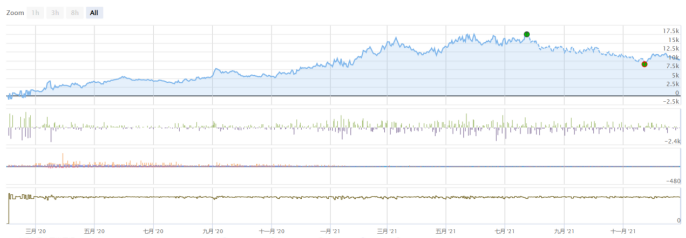
Using Binance U-denominated contracts, the PSY factor parameter is designed to be 12. Backtesting of BTC-USDT and ETH-USDT contracts was conducted from February 1, 2020 to December 31, 2021 with a slippage of 10, a transaction fee of 0.05%, a leverage of 10 times, and each position remaining principal at 5%:
BTC-USDT:
ETH-USDT:
PART5 Summary
In this article, we upgraded and transformed the traditional psy factor, resulting in a psy+price+vol factor that can measure the strength of bulls and bears over a past period at the level of volume and price. Using fixed numerical comparisons or self-strength comparisons, corresponding momentum/reversal signals can be constructed. This article finally established a fixed numerical signal, conducted simple strategy backtesting, and found that the psy+price+vol factor can capture momentum movements in volatile markets to some extent, achieving positive expected returns. More forms of signals can be constructed later for more types of factor tests before ultimately being added to an existing strategy library.
Thanks to the FMZ Platform, for not closing its doors and reinventing the wheel, but providing such a great place for traders to communicate. The road of trading is full of ups and downs, but with warmth from fellow traders and continuous learning from the shared experiences of seniors on the FMZ platform, we can keep growing. Wishing FMZ all the best and may all traders enjoy long-lasting profits.