Welcome all traders to my channel, I am a Quant Developer, specializing in full-stack development of CTA, HFT & Arbitrage trading strategies.
Thanks to the FMZ Platform, I will share more content related to quantitative development and work together with all traders to maintain the prosperity of the quant community.
- Do you often struggle to distinguish between trends and fluctuations?
- Have you been stopped out by the back-and-forth disorderly market?
- Are you having difficulty understanding the current market situation?
- Do you do trend trading and hope to filter out fluctuations?
Haha, you’ve come to the right place. Today, I will bring you the construction and application of market noise! As we all know, financial markets are full of noise. How to quantitatively model and depict market noise is very important. The depiction of noise can better help us distinguish the current state of the market and predict future possibilities!
PART1 Noise discrimination is very important for financial market trading.
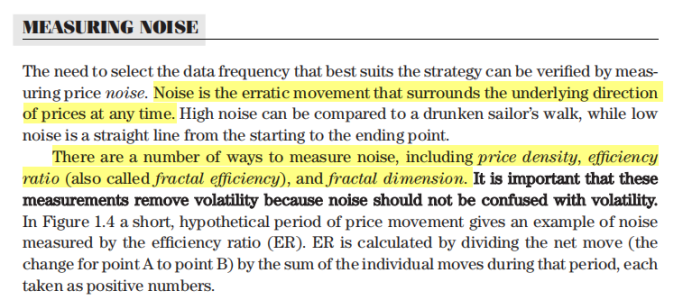
The time series in the financial market is characterized by a high signal-to-noise ratio, most of the time, the market fluctuations are unclear, and even during trending markets, situations like taking four steps forward and three steps back often occur. Therefore, defining, identifying and classifying market noise in the financial market is very important and has practical significance. Kaufman’s book provides a comprehensive explanation and modeling of this characteristic of noise.
PART2 Construction of Noise – ER Efficiency Coefficient
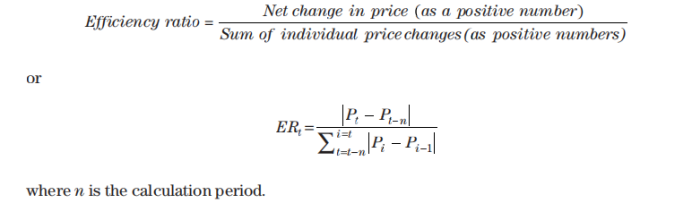
The net value of the starting and ending points of price changes divided by the sum of all pairwise price changes during the period.
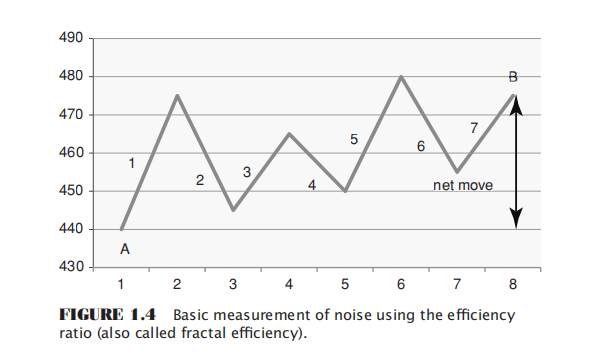
The difference between point A and point B divided by the sum of the 7 intermediate movements.
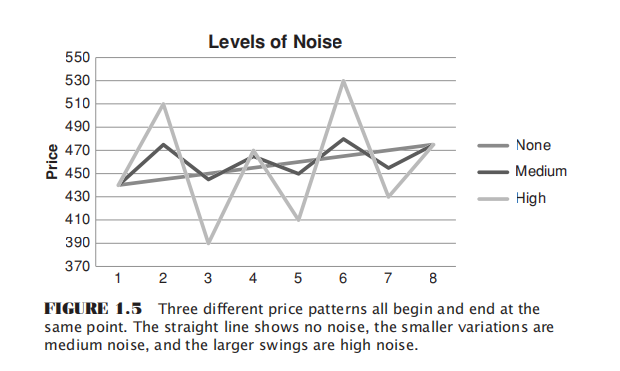
It demonstrates the different noise levels exhibited by various price operation modes under the same price movement range. A straight line indicates no noise, minor fluctuations around the straight line represent medium noise, and large swings symbolize high noise.
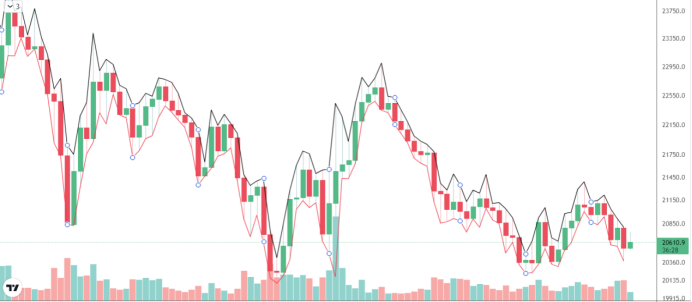
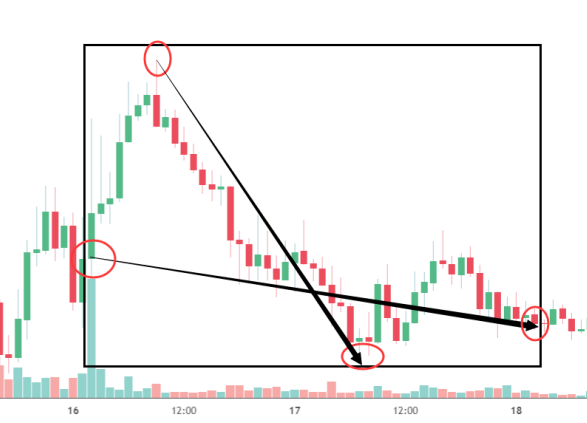
PART3 Construction of Noise – Price Density
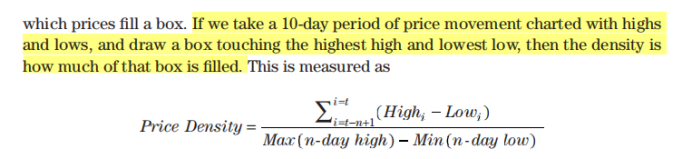
The definition here is: Drawing the high and low points of price movements over a period of time, pulling the highest and lowest prices during this period into a box. The so-called price density refers to the number of price points that can be accommodated within the box.
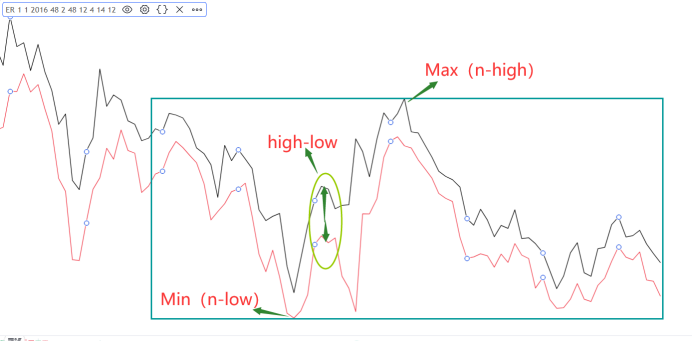
Compared to the ER efficiency coefficient, the measurement method of price density takes more into account the highest and lowest prices of each K-line.
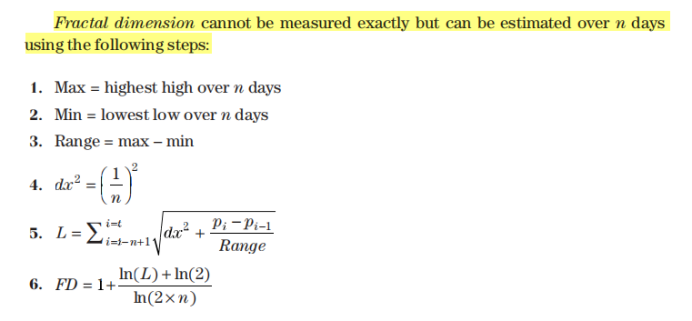
PART4 Construction of Noise – Fractal Dimension
The fractal dimension cannot be measured accurately, but it can be estimated using the following steps within the past n terms:
PART5 Construction of Noise – Other Methods
CMI = (close[0] – open[n-1]) / (Max high(n) – Min low(n));
When the noise is lower, during this period, the net value at the beginning and end infinitely approaches the difference between the highest and lowest prices, with CMI infinitely approaching 1.
The results obtained from the construction methods of various noise measurements are highly similar. The core is to compare the net changes and change processes or extreme values of a period of movement, and choose the construction method that you prefer or think is more reasonable.
PART6 Dividing market styles from the perspectives of noise and volatility.
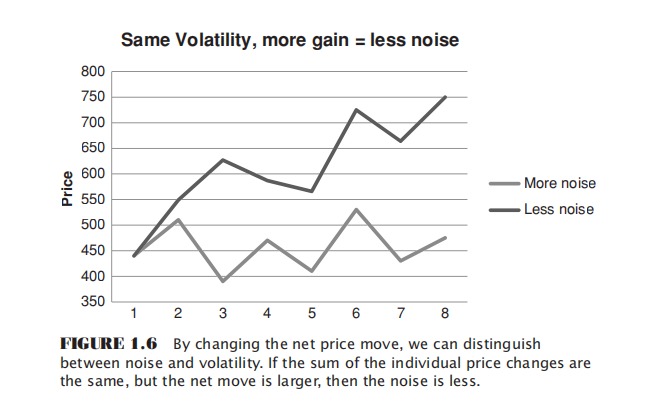
Volatility and noise are different dimensions to characterize the market. The sum of price changes in the two types of price models mentioned above is the same, so their volatility is the same, but net value changes more significantly and noise is lower.
Therefore, noise and volatility are two different perspectives that can be used to classify market styles. If we take persistence and volatility of trends as the x-axis and y-axis respectively to construct a Cartesian coordinate system, we can divide the fluctuation status of market prices into four categories:
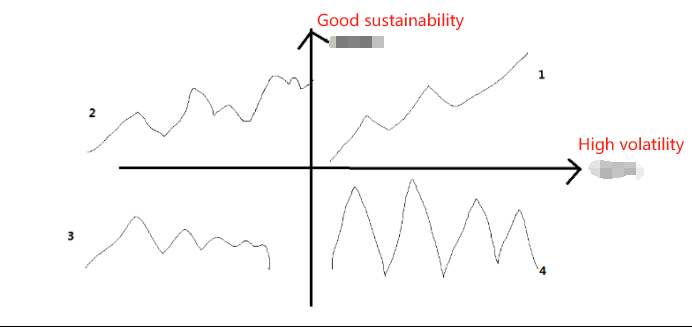
- Good sustainability, high volatility – smooth trend.
- Good sustainability, low volatility – bumpy trend.
- Persistent poor performance, low volatility – narrow range consolidation.
- Persistent poor performance, high volatility – wide range fluctuations.
It should be pointed out that there are no absolute standards for what is called wide range and narrow range, it has to be relative to the level and system of one’s own trading, just like the setting of the trading period, which is extremely personalized. Moreover, we can only determine the current state of the market by examining a period in the past. However, we cannot predict what state the market will enter next.
Of course, the four types of fluctuations are not completely random during conversion. In the most ideal state, a smooth trend is often followed by wide-range oscillations, slowly unloading momentum; then it enters narrow-range consolidation, the market is very inactive, and bulls and bears are stuck in a stalemate; when the market is compressed to a critical point, it explodes again and the trend begins; this is an oversimplified ideal model – reality is much more complex. For example, after narrow-range consolidation there may not necessarily be a trend – it could also be wide-ranging oscillation. After a smooth trend there might not necessarily be wide-ranging oscillation – it could continue to reach new highs or lows. Moreover, it’s difficult to develop four strategies that excel at handling four different market conditions and can adapt as needed. So for now, I still think we can only develop strategies that make money in certain markets while minimizing losses in unfavorable ones.
PART7 Impact of Noise on Related Transactions
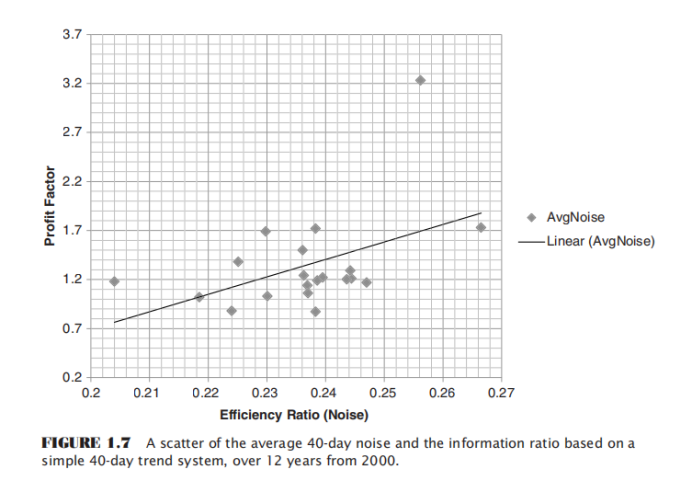
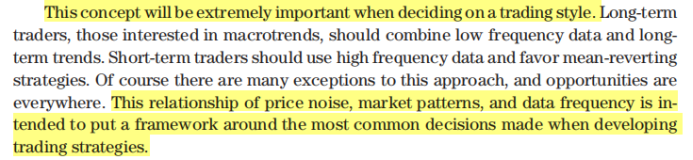
The profit factor of the 40-day moving average strategy (going long above the 40-day line and short below, total profit/total loss) is regressed with the 40-day noise (ER efficiency coefficient). It can be seen that the higher the noise, the lower the profit factor of trend strategies. And we can conclude: low noise is beneficial for trend trading, high noise is beneficial for mean reversion trading.
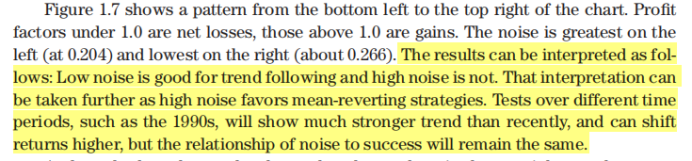
The concept of market noise is very important in determining trading styles. Before developing corresponding trading strategies, we need to outline the contours of the market.
PART8 Market Maturity and Noise
Over the past 20 years, the noise attribute of the North American stock index market has experienced a steady rise.
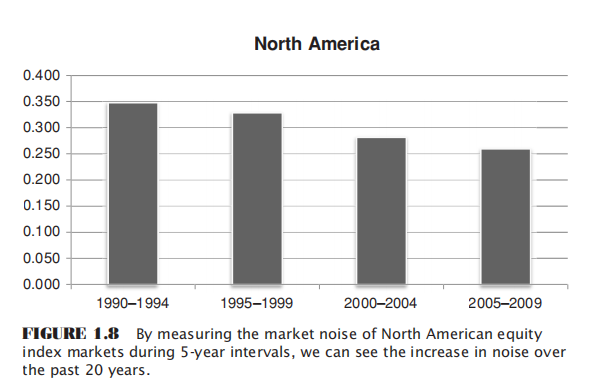
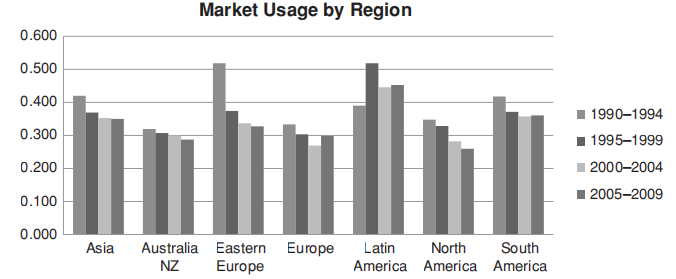
Financial markets in various regions are gradually maturing, with noise levels increasing progressively, and the maturity is coming quickly.
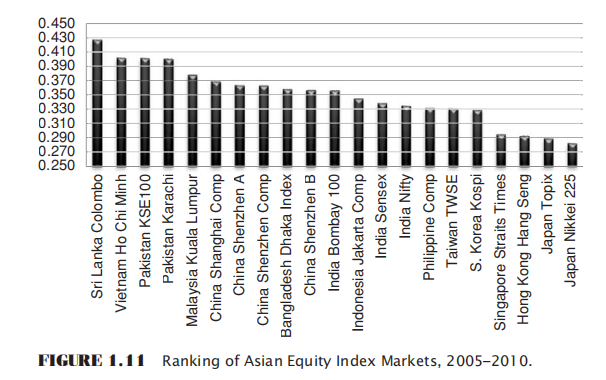
A study was conducted on the stock index markets of various countries. The market on the far right is the most mature and also has higher noise, while the one on the far left is immature with lower noise. It can be observed that Japan has the most mature market, followed by economies like Hong Kong, China, Singapore, and South Korea. On the far left are relatively immature markets, such as Vietnam and Sri Lanka.
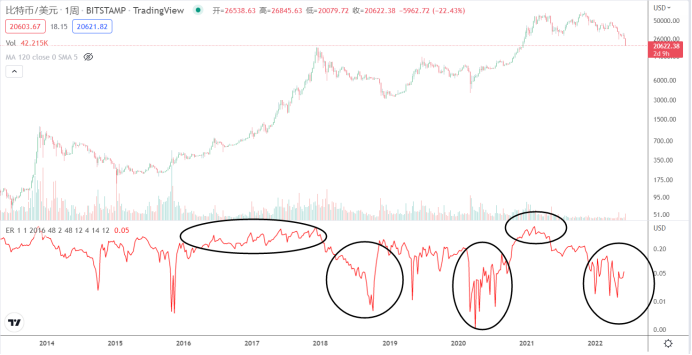
The noise in the Bitcoin market for each quarter is approximately 0.2-0.3, and it’s in a cyclical state.
Thanks to the FMZ Platform, for not closing its doors and reinventing the wheel, but providing such a great place for traders to communicate. The road of trading is full of ups and downs, but with warmth from fellow traders and continuous learning from the shared experiences of seniors on the FMZ platform, we can keep growing. Wishing FMZ all the best and may all traders enjoy long-lasting profits.