On the very first day GPT 5.6 launched, I wanted to try it out.
I could have written a small utility, run a few prompts, and called that an evaluation. But that felt a little pointless. To find out whether a new model is actually good, you need to give it a genuinely troublesome project—one full of edge cases and awkward details. So I dug up a Polymarket ETH 15-minute strategy that I had been running for a long time.
The old version was not unusable. Its win rate even looked fairly decent. The problem was that each winning trade made only a little, while losing trades gave back a lot. That had bothered me for quite a while, so it became a good test of how far GPT 5.6 sol could push the strategy.
Let me start with something that sounds exaggerated but is genuinely true: this project consumed tens of millions of GPT 5.6 sol tokens from beginning to end. In the end, I copied the code into FMZ, and it worked on the first try—no errors, it simply started running.
But “it runs” and “it makes money” are two completely different things. That needs to be made clear up front, otherwise the rest of the article could easily be misunderstood.
The Starting Point: The Win Rate Looked Good, but the Money Did Not Stay
I had already run this Polymarket ETH 15-minute strategy for quite a long time.
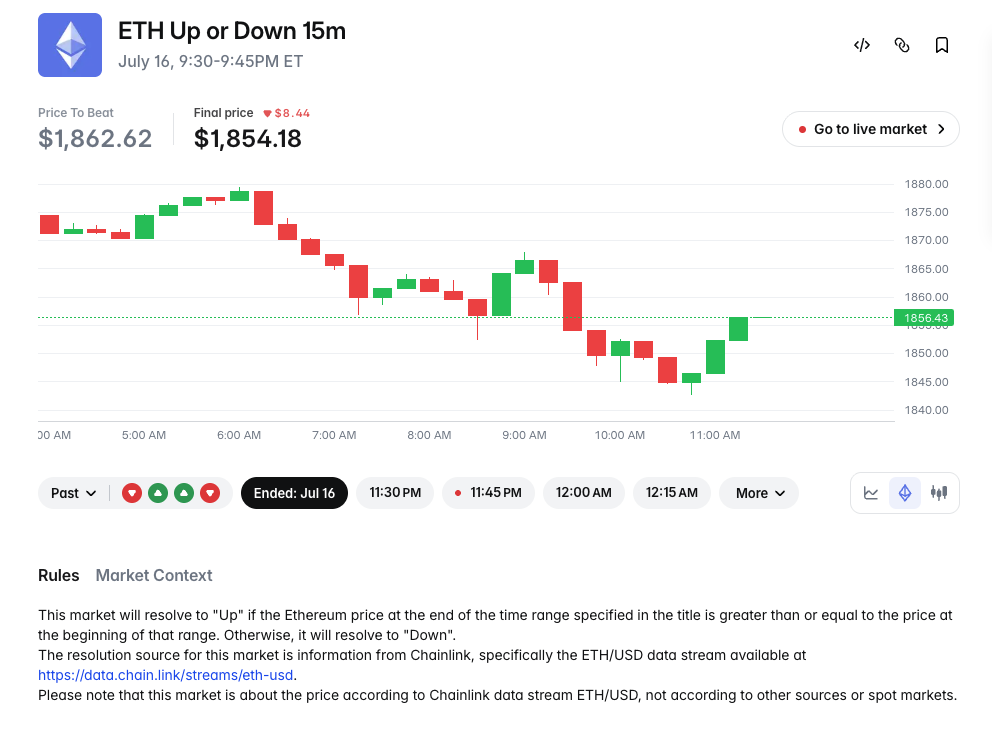
The market is easy to understand: each round lasts 15 minutes. If the ending price is above the opening reference price, the result is Up; if it is below the reference price, the result is Down. It looks extremely simple—almost like flipping a coin.
The old version actually had a reasonable win rate, but it had an annoying problem: it would usually make a little on each winning trade, then give back a large chunk on one mistake. Sometimes it won several rounds in a row and the equity curve slowly climbed. Then one large loss erased most of the previous progress.
This is one of the easiest traps to fall into in prediction markets.
Suppose Up is already trading at 0.85. If you buy it, the most you can make is 0.15, while a loss could cost you 0.85. Roughly speaking, the loss-to-profit ratio is already:
0.85 / 0.15 ≈ 5.67
In other words, a high win rate does not necessarily mean profitability. The price you pay, fees, slippage, and the occasional total loss will all come back to settle the account.
So during this reconstruction, I stopped asking, “How can I make the win rate even higher?” and replaced it with a different question:
Is the true probability of this contract actually high enough above its market price?
That sounds like a single sentence, but more than 4,000 lines of code ended up dealing with everything required to answer it properly.
First Separate the Three Prices, or Everything Gets Messier
This strategy watches Chainlink, Binance, and Polymarket at the same time. All three provide ETH prices, but they serve completely different purposes.
Chainlink RTDS: Official reference price and settlement basis
Binance: Short-term lead, momentum, and volatility observation
Polymarket CLOB: Bid/ask prices, depth, fees, and actual execution
At first, I also had the instinct to treat Binance as the “real price,” because it updates quickly and has deep liquidity. But that does not work in this market.
Chainlink Is the Referee
Polymarket-style 15-minute markets determine the outcome using a specified price source. The strategy must capture the official Price-to-Beat at each round boundary, and all later Up or Down calculations are based on that value.
There is an easy shortcut to take here: if the strategy starts in the middle of a round, can it simply use the Chainlink price observed at startup as the opening price for that round?
No. A difference of a few dollars may look insignificant, but in the final few dozen seconds it can completely reverse the direction.
So if the strategy cannot find the official reference price for the current round, it skips the entire round. If it appears to “do nothing” immediately after startup, that does not necessarily mean it is broken. It may simply be waiting for the next round and the correct starting point.
Binance Is More Like a Sideline Observer
Binance ETH/USDT updates quickly and is useful for observing:
- which direction price has moved over the last five seconds;
- the usual spread between Binance and Chainlink;
- whether volatility has suddenly increased;
- whether Binance has moved slightly ahead of Chainlink.
But Binance does not make the final ruling. It can provide clues, but it cannot replace Chainlink as the settlement authority.
Polymarket Is Where the Purchase Actually Happens
A model probability of 90% is meaningless if the market is already charging nearly 89% after costs.
For example, if the theoretical win probability is 90% but the total contract acquisition cost is already close to 89%, I would rather skip the trade. It may look almost certain to win, but the available profit margin is paper-thin, and even a small error can wipe it out.
What the strategy actually cares about is:
Net edge = conservative probability - actual fill price - entry fee - exit-cost reserve
The corresponding code is:
netEdge = conservativeProb - cappedFillPrice - entryFee - exitReserve
Notice that this uses a conservative probability, not the raw model probability. It also does not use the attractive top-of-book quote, but an executable price estimated from market depth. If either assumption is too optimistic, the backtest and live execution can become two completely different systems.
Why Only Trade Between 105 and 45 Seconds Before the End?
A round lasts 900 seconds, but the strategy only allows entries during:
T+795 seconds to T+855 seconds
In other words, between 105 and 45 seconds before settlement.
Why not search for opportunities from the beginning of the round? Because when the round is still young, ETH has plenty of time to move around. A small lead now could turn into several crossings of the reference price over the next five minutes.
Then why not simply buy in the final ten seconds, when the outcome is more certain? That does not work well either.
In the final ten seconds, network latency, disappearing liquidity, and order-status confirmation suddenly become much more important. You may not even know whether the order filled before the market has already ended. If something goes wrong, there is no time left to handle it.
The 105-to-45-second window is not a magical answer. It is just the current compromise: the result is becoming clearer, while there is still some time left for execution. With enough samples, this window can be divided and studied more carefully later.
Turning “How Far Ahead” into a Probability
The strategy first calculates how far the current Chainlink price is from the round’s reference price:
rawGap = direction × log(current Chainlink price / round reference price)
When evaluating Up, a price above the reference becomes a positive distance. When evaluating Down, the direction is reversed. The logarithm is mainly used to make upward and downward changes more symmetrical.
Next, the strategy looks at Binance’s lead residual relative to Chainlink. I intentionally made this adjustment conservative:
- a Binance lead favorable to the current direction is trusted at only 35%;
- an unfavorable move is counted in full;
- the total adjustment is capped at 3 bps;
- another 2 bps is deducted to allow for uncertainty in the reference price.
In simple terms, good news gets discounted first, while bad news is temporarily treated as real. This may cause the strategy to miss some opportunities, but at least the model is less likely to become impressed with its own optimism.
The strategy then uses recent one-minute candlesticks to estimate short-term volatility and scales it by the remaining time:
Remaining volatility ≈ per-second volatility × stress factor × sqrt(remaining seconds + latency buffer)
This produces a z-score:
z = safe lead distance / remaining volatility
A 10-dollar lead may be very safe in a quiet market. In a market that can move dozens of dollars within a minute, the same lead means very little. The z-score is an attempt to compare “distance” with “how far the market could still move.”
The normal cumulative distribution function is then used to convert z into a probability. But the strategy does not trade directly on that probability. It first shrinks it toward 50%, applies another haircut, and constrains the final range.
The current default thresholds are:
z-score ≥ 1.45
Conservative probability ≥ 86%
These parameters are not mathematical truths. They are simply the starting point of the research. After the strategy has run long enough, they should be revised using actual settlement samples rather than trusted indefinitely because the formula looks elegant.
Passing the Probability Threshold Still Does Not Mean Buying
This is somewhat counterintuitive. If the model already says the probability is above 86%, why not place the order?
Because a correct prediction can still be a bad trade.
The strategy also checks:
- whether the ask price is inside the permitted range;
- whether the bid-ask spread has widened suddenly;
- whether the complementary prices of Up and Down look abnormal;
- whether the market has jumped suddenly in the last five seconds;
- whether short-term momentum is moving against the position;
- how much net edge remains after fees;
- whether the order book is deep enough to hold the order.
In normal mode, the allowed ask range is approximately 0.65–0.86. In fixed 1 USDC market-order mode, the strategy is more conservative and will only buy up to 0.80.
Some people may understand the upper limit but wonder why the strategy also refuses to buy below 0.65. Isn’t cheaper always better?
Under normal conditions, a direction that is clearly leading in the final stage and has a very high model probability should not be absurdly cheap. If the model says 90% while the market is selling it for only 0.55, do not rush to call it a bargain. More likely, some data is out of sync, the reference price is wrong, or the market knows something the strategy does not.
A cheap price is sometimes an opportunity and sometimes an alarm. Since the program cannot distinguish every case, it chooses not to buy.
The Signal Must Hold, and the Order Book Must Be Read Again
When an entry signal first appears, the strategy does not immediately rush into the market. By default, it requires three consecutive confirmations over at least 800 ms.
The same quote read repeatedly by the main loop cannot simply be counted as three confirmations. Key checks require new source ticks. Otherwise, a stale price could be mistaken for a stable signal.
Even after confirmation, the process is not finished. Immediately before placing the order, the strategy will:
- fetch the full REST depth for both Up and Down again;
- rerun the probability and market-condition checks from the beginning;
- recalculate VWAP, fees, and net edge using the new depth;
- refresh the target-side order book separately in 1 USDC market-order mode.
If any condition fails during the recheck, the trade is abandoned.
This costs some speed, certainly. But I would rather lose a little speed than buy the current market using an order book snapshot from 800 ms ago. In the final stage of a 15-minute round, 800 ms is not always a short time.
A 1 USDC Order Is Real Trading, Not an API Demonstration
This version includes a dedicated fixed 1 USDC market-buy path, mainly for live testing with a small account.
Under FMZ’s Polymarket adapter:
- the amount of a market
BUYis specified in USDC; - the amount of a market
SELLis specified in shares; - limit orders usually have a minimum size of 5 shares;
- market buys can be executed with an order value of 1 USDC.
This avoids having to enlarge each trade simply to reach five shares.
But one calculation cannot be ignored: if the account contains only 9 dollars, a 1-dollar trade plus fees can lose more than 11% of the entire account in the worst case. A few consecutive losses can quickly leave too little capital to continue collecting samples. So “it is only one dollar” is true in absolute terms, but the percentage risk is not small at all.
The current small-account mode includes these restrictions:
- no more than two trades per day;
- no more than one unsettled position at a time;
- worst-case risk per trade cannot exceed 15% of account equity;
- if the next trade were a total loss, it cannot breach the session drawdown limit;
- consumed depth cannot exceed 15% of visible market depth;
- permitted entry slippage cannot exceed one percentage point;
- net edge must be at least 6.5%;
- the maximum loss-to-profit ratio cannot exceed 4.5.
There is another awkward real-world issue: after buying 1 dollar worth of a contract, if the position falls sharply, its sale value may drop below the exchange’s minimum active-sell amount. In other words, you may want to stop out, but the order cannot even be submitted.
That is why the strategy calculates worst-case loss from the moment of entry under the assumption that the contract may go to zero. It does not assume that a stop-loss order will definitely fill. This is especially important for very small positions.
The Order Code Is Not Hard. The Hard Part Is Knowing Whether It Filled
Strategy tutorials often show code like this:
if (signal) {
    exchange.Buy(price, amount)
}
Live trading is not that cooperative. A request may time out even though the order was never sent—or even though it already filled. A cancel request may succeed after the order has already been partially filled. WebSocket may report a fill before REST has updated. Worse still, the program may restart immediately after execution and lose all in-memory state.
If this is not handled properly, the strategy may not only miscalculate returns—it may buy the same position twice.
That is why a large amount of code is devoted to the order state machine. The rough logic is:
- Write an intent before sending the order
Persist what the strategy intends to buy in the current round before sending the request to the exchange. If the process crashes in the middle, the restarted strategy still knows that there is an unresolved action to investigate. - Allow only one intent per round
A brief network failure must not become an extra purchase. Until the previous intent is resolved, the strategy does not create another attempt. - Check partial fills after cancellation
Cancelling the remainder does not mean nothing was filled. Order reports, trade records, and the actual position must be checked together. - Market orders also have an observation period
If the API temporarily showsFAILEDorCANCELED, the strategy does not immediately assume zero fill. It cross-checks the order query, User WebSocket, user-trade REST data, and position changes. - If it cannot be resolved, stop
When the strategy can neither prove that nothing filled nor determine the filled amount, it fails closed, stops trading, and waits for manual verification.
This is somewhat clumsy, but it is more reliable than “send another order and see what happens.” Missing one trade is an opportunity cost. Buying twice by mistake can become an incident.
After Buying the Right Side, Do Not Rush to Trade Away a Few Cents
The correct side of a prediction-market contract pays out at 1, while the wrong side goes to zero. If the entry logic remains valid, frequent profit-taking often means paying another round of spread and fees.
The basic idea is therefore to hold winners until official settlement whenever possible and sell only when the risk has genuinely changed.
The main exit triggers include:
- Chainlink officially crossing the round reference price;
- z-score falling below a hard threshold;
- actual loss reaching the hard stop;
- the current sellable price moving clearly above the model’s fair value;
- key data remaining unavailable near the end of the round;
- a soft exit signal being confirmed across consecutive new ticks.
If the position is too small and its sale value does not meet the exchange’s minimum threshold, the strategy does not repeatedly submit an order that is guaranteed to be rejected. It can only wait for official settlement.
The final result is determined exclusively by Polymarket’s official market state. Whether Binance rose or whether the strategy “believes” it won does not count. Only after official confirmation does the strategy enter the redeem process.
First Let It “Pretend to Trade,” Then Talk About Live Execution
The strategy defaults to:
var SimMode = true
Simulation mode does more than display signals on the screen. Opportunities that satisfy all live-trading conditions—and therefore would have triggered a real order—are stored as shadow trades.
Samples are grouped across three dimensions:
- entry ask range;
- z-score range;
- time remaining until settlement.
After the market officially settles, each bucket is updated with the sample count, number of wins, realized profit and loss, model edge, and the one-sided Wilson confidence lower bound.
Why use something as academic-sounding as the Wilson lower bound? Consider a simple example: if nine out of ten trades win, the observed win rate is 90%, but ten samples are far too few. Nobody knows what the next ten trades will look like. Feeding 90% directly back into the model is an easy way to overestimate performance.
For live calibration, the strategy uses:
Effective probability = min(model probability, empirical win-rate confidence lower bound)
In other words, historical samples are allowed to cool the model down, but they are not allowed to inflate an ordinary signal into a miracle trade.
The current recommendation is to collect at least 300 shadow samples first. Even when the overall sample count is sufficient, a specific entry bucket still needs at least 25 samples and must pass the net-edge check.
The number 300 does not mean the strategy “graduates” at that point. It is simply more credible than a dozen or two observations. Market regimes change, and sample distributions can become biased. Those issues still need to be monitored.
The Status Panel and JSONL Logs Are More Useful Than a Beautiful Equity Curve
After a strategy has been running for several days, logs containing only “buy succeeded” and “sell succeeded” are almost useless for research.
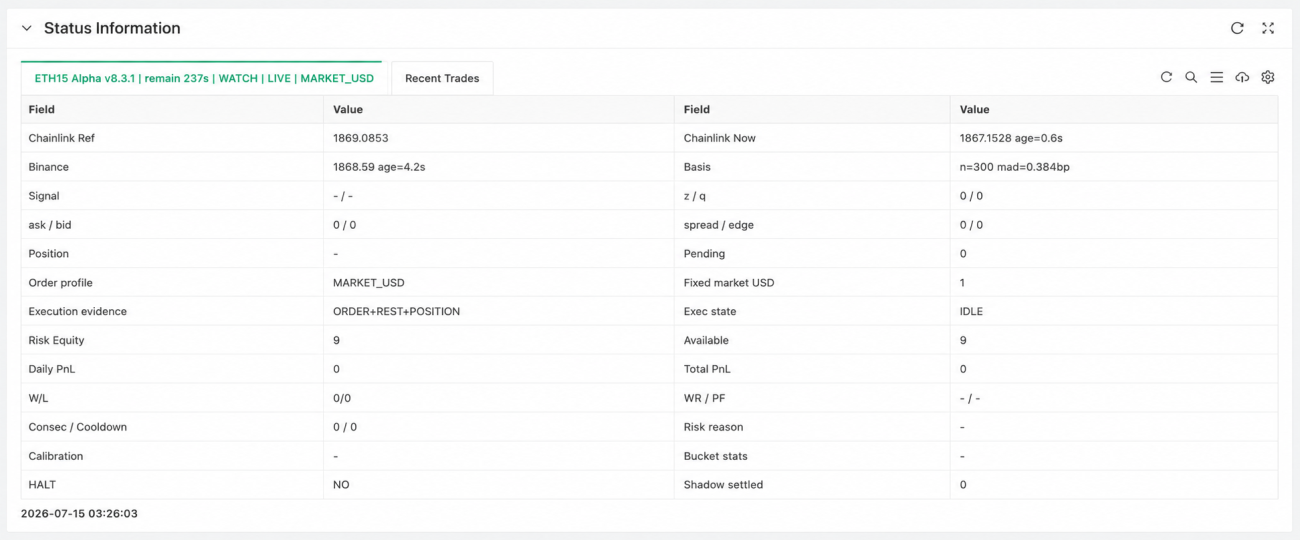
The FMZ status panel displays the current round, reference price, Chainlink and Binance data age, direction, z-score, probability, order-book state, fees, net edge, account risk, shadow samples, recent settlements, and other information.
Detailed events are also written to:
pm_eth15_alpha_v8.jsonl
The file records why signals were rejected, the volatility at the time, shadow-strategy snapshots, order intents, partial fills, position diagnostics, official settlements, and recovery procedures.
These logs look verbose in the short term, but after the strategy has run for a while, they become the most valuable part. What I really want to investigate is not simply “how many trades did it win yesterday,” but:
- Is buying at 0.70 or buying at 0.80 more profitable after costs?
- Does a higher z-score actually correspond to a higher win rate?
- How different are the 45–75-second and 75–105-second windows?
- How much of the paper edge was actually realized?
- Was profit lost to fees, slippage, or exit logic?
Without preserving the original context, looking back at the equity curve a few days later often leads to explanations that are little more than imagination.
Where Did Tens of Millions of Tokens Go?
That number is certainly attention-grabbing. If all I had asked the AI to do was write a moving-average crossover strategy, consuming that many tokens would have been absurd.
But most of the consumption in this project was not about predicting whether ETH would rise or fall in the next minute. It went into dozens of small but unavoidable edge cases:
- how to capture and recover the official reference price;
- how to align timestamps across three data sources;
- how to use Binance only as an auxiliary source without contaminating the settlement logic;
- whether probability shrinkage or fee deduction should be applied first;
- how to account for USDC on market
BUYorders and shares in the resulting position; - minimum order sizes, partial fills, and conflicting order states;
- what happens if the program restarts at exactly the wrong moment;
- how to prevent duplicate orders within the same round;
- whether the shadow strategy and future live strategy use exactly the same conditions;
- when redemption is allowed after official settlement.
None of these issues is especially profound by itself. Combined, they become exhausting. Change one convention and the status panel, position accounting, risk calculation, and logs may all need to be updated. A lot of tokens were spent repeatedly checking these interactions.
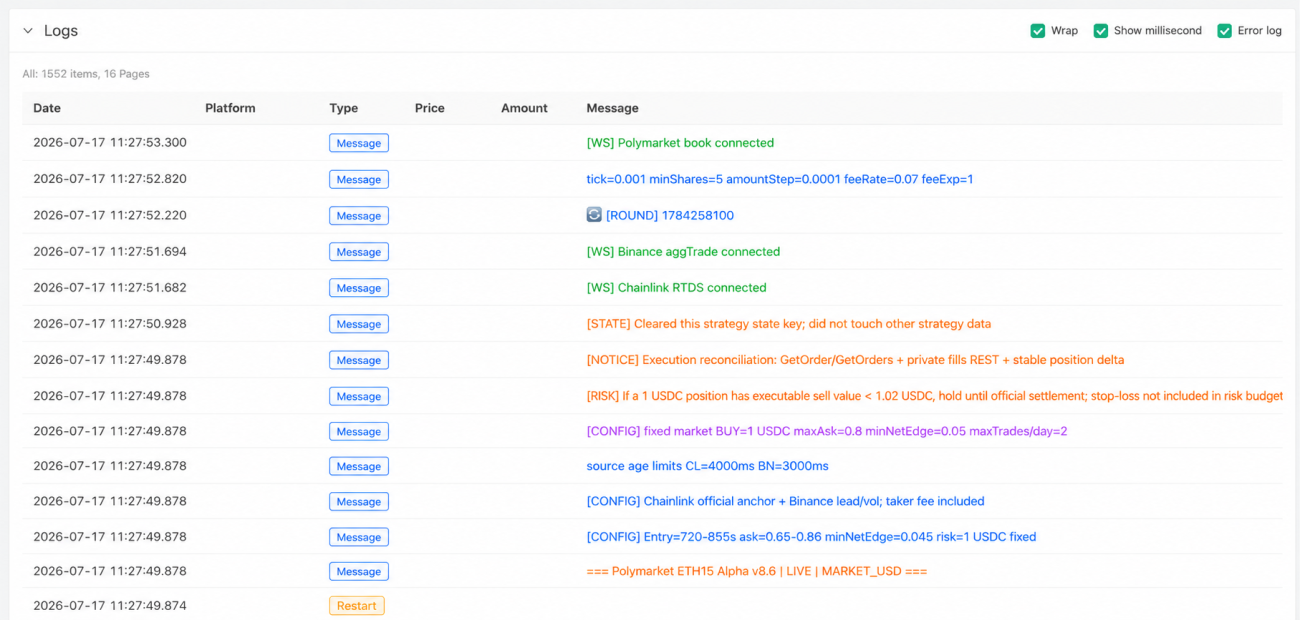
The most interesting thing about “first try, zero errors” was not that the AI had proved it could make money. It was that such a long FMZ strategy started successfully the first time it was pasted in, with WebSocket connections, the status panel, simulation flow, and logging all running. From an engineering perspective, that saved a great deal of frustration.
Whether there is any Alpha still has to be answered honestly by the samples. Long code does not automatically create a higher win rate.
If You Plan to Run It, Do Not Disable Simulation Too Quickly
My own sequence would look roughly like this.
First, keep:
var SimMode = true
Confirm that Chainlink, Binance, and Polymarket are all connected correctly, that the data-age indicators in the status panel do not frequently turn red, and that the JSONL file continues to update.
It is best to start the strategy shortly before a new round begins. If the strategy skips the current round after starting midway through it, do not rush to remove the protection logic. Wait for the next round and check whether the reference price is captured correctly.
Then collect shadow samples. Three hundred trades are only the first threshold. What matters more is the sample count in each bucket, the Wilson lower bound, average realized P&L, and the gap between theoretical edge and realized edge.
Next, examine fees before the win rate. Prediction markets are very good at creating the illusion of success: the trade history is full of green, but the account balance barely moves. Only after including actual fill prices, fees, and full losses can you determine whether the expectation is positive.
Only then should you consider very small live trades. Even if every trade is fixed at just 1 USDC, you still need to confirm that the account setup, signing method, User WebSocket, minimum-order rules, and current FMZ adapter behavior all match.
Only after everything is ready should you switch to:
var SimMode = false
A 9-dollar account can theoretically run the 1-dollar mode, but the margin for error is extremely small. It is more suitable for verifying real execution and accounting than for proving long-term strategy performance. A few consecutive losses could end the sample experiment early.
A Few Final Thoughts
polymarket_eth15m_alpha_v8 appears to predict whether ETH will finish Up or Down, but most of the time it is actually rejecting trades.
If the reference price is uncertain, do nothing. If data is stale, do nothing. If the spread is too wide, do nothing. If the fees erase the edge, do nothing. If depth is insufficient, do nothing. If the order state cannot be resolved, stop entirely.
The actual order may take only a moment, but it is preceded by a long series of “no.”
In the past, when a strategy had a signal but did not buy, I felt as though it had missed money. Now I am more inclined to think that filtering out high-win-rate trades that are still economically unattractive may be the most valuable feature of this version.
GPT 5.6 sol, tens of millions of tokens, first-run success, zero errors—of course that makes for a good story. I also find it somewhat unbelievable.
But whether the strategy survives will not be determined by token count or lines of code. It comes down to one thing:
Is the probability sold to you by the market genuinely cheaper than what it is worth?
The rest can be answered slowly by the samples.
Full Strategy Source Code
Finally, I am sharing the strategy with everyone. The source code below can be copied directly into an FMZ JavaScript strategy.
The source defaults to SimMode = true. After copying it, readers will first enter simulation and shadow-sample mode. Live trading requires changing the mode.
Risk Warning
This article is only a discussion of strategy research and program design. It does not constitute investment advice and does not promise returns. Prediction-market contracts can fall to zero and involve liquidity, slippage, API, fee, settlement, regulatory, and smart-contract risks. A strategy starting with zero errors does not mean the logic has zero risk, nor does it mean the strategy can generate stable profits in the future. Before live trading, conduct sufficient simulation, shadow-sample calibration, and small-scale validation.