In the Forex trading system, the Pivot Points trading method is a classic trading strategy. Pivot Points is a very simple resistance support system. Based on yesterday’s highest, lowest and closing prices, seven price points are calculated, including one pivot point, three resistance levels and three support levels.
The resistance line and the support line are one of the tools that are often used in technical analysis, and the role of the support line and the pressure line can be mutually transformed. From a trading point of view, Pivot Point is like a combat map, pointing out the support and resistance price that should be paid attention to by investors. As for the specific tactical cooperation, Pivot Point does not specifically stipulate it, depending on the investor itself.
For this trading strategy. Investors can flexibly formulate strategies based on intraday prices and related trends in pivot points, support levels and resistance levels, and can even manage position adjustments based on key points.
Schematic diagram of the R-Breaker strategy
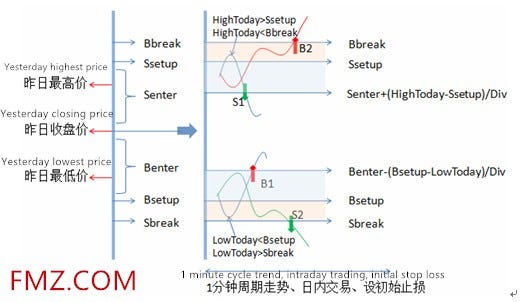
R-Breaker calculated six price points based on yesterday’s price as the reference price for today’s intraday trading, but only one pivot point less than the Pivot Points setting. The difference between R-Breaker and Pivot Points is that the parameter setting makes the distance between the six prices more flexible, and R-Breaker clarifies the specific trading strategy.
According to the intraday price movement, the trend tracking and reversal strategy is adopted at the same time. The area with the color background in the picture can be regarded as the observation area. When the highest price in the day hits the Ssetup and falls back, and falls below the resistance line of the reference Senter, the reverse strategy is adopted,
that is, the short position is opened at the point S1; if there are no position holding, if the intraday price breaks through the resistance line of Bbreak, the trend tracking strategy is adopted, that is, the long position is opened at B2. Similarly, the B1 point is reversed and the S2 point is for open short position.
Since the trigger condition for opening a position involves multiple price positions and is sensitive to intraday price movements, the strategy applies to trading on a one-minute time period. In addition, the number of transactions triggered by this strategy is not many, regardless of the conditions of the cross-cycle.
NPeriod=2 //period
f1=0.47   //Middle rail upper and lower top section coefficient
f2=0.07   //Mid-rail upper and lower interval coefficient
f3=0.25   //Upper and lower rail coefficients
//==========================================
//API: A simple example of the Chart function (drawing function)
var chart = { // This chart is an object in the JS language. Before using the Chart function, we need to declare an object variable chart that configures the chart.
  __isStock: true,                                    // Whether the markup is a general chart, if you are interested, you can change it to false and run it.
  tooltip: {xDateFormat: '%Y-%m-%d %H:%M:%S, %A'},    // Zoom tool
  title : { text : 'Market analysis chart'},          // title
  rangeSelector: {                                    // Selection range
      buttons:  [{type: 'hour',count: 1, text: '1h'}, {type: 'hour',count: 3, text: '3h'}, {type: 'hour', count: 8, text: '8h'}, {type: 'all',text: 'All'}],
      selected: 0,
      inputEnabled: false
  },
  xAxis: { type: 'datetime'},                         // The horizontal axis of the coordinate axis is: x axis. The currently set type is: time.
  yAxis : {                                           // The vertical axis of the coordinate axis is the y-axis. The default value is adjusted according to the data size.
      title:{text: 'Market calculus'},                // title
      opposite:false,                                 // Whether to enable the right vertical axis
  },
  series : [                                          // Data series, this property holds the various data series (line, K-line diagram, label, etc..)
      {name:"0X",id:"0",color:'#FF83FA',data:[]},
      {name:"1X",id:"1",color:'#FF3E96',dashStyle:'shortdash',data:[]},
      {name:"2X",id:"2",color:'#FF0000',data:[]},
      {name:"3X",id:"3",color:'#7D26CD',dashStyle:'shortdash',data:[]},
      {name:"4X",id:"4",color:'#2B2B2B',data:[]},
      {name:"5X",id:"5",color:'#707070',dashStyle:'shortdash',data:[]},
      {name:"6X",id:"6",color:'#778899',data:[]},
      {name:"7X",id:"7",color:'#0000CD',data:[]},
      //RGB color comparison table  http://www.114la.com/other/rgb.htm
  ]
};
/*
//Pivot Points strategy
chart["series"][0]["name"]="resistance3:";
chart["series"][1]["name"]="resistance2:";
chart["series"][2]["name"]="resistance1:";
chart["series"][3]["name"]="Pivot point:";
chart["series"][4]["name"]="Support position1:";
chart["series"][5]["name"]="Support position2:";
chart["series"][6]["name"]="Support position3:";
chart["series"][6]["name"]="Current price:";
*/
///*
//R-Breaker strategy
chart["series"][0]["name"]="Bbreak_A1:";
chart["series"][1]["name"]="Ssetup_A2:";
chart["series"][2]["name"]="Senter_A3:";
chart["series"][4]["name"]="Benter_B1:";
chart["series"][5]["name"]="Sbreak_B2:";
chart["series"][6]["name"]="Bsetup_B3:";
chart["series"][7]["name"]="Current price:";
//*/

var ObjChart = Chart(chart);  // Call the Chart function to initialize the chart.
ObjChart.reset();           // clear
function onTick(e){
        var records = _C(e.GetRecords);  //Return a K-line history data
        var ticker = _C(e.GetTicker);    //Return a Ticker structure
        var account = _C(e.GetAccount);  //Return the main exchange account information
        var High = TA.Highest(records, NPeriod, 'High'); //Highest price
        var Close = TA.Lowest(records, NPeriod, 'Close');       //Closing price
        var Low = TA.Lowest(records, NPeriod, 'Low');   //Lowest price
        /*
        //Pivot Points strategy
        //A up 7235 A middle 7259 A down 7275 B up 7195 B middle 7155 B down 7179
        Pivot = (High+Close+Low)/3 //Pivot point
        var Senter=High+2*(Pivot-Low)  //resistance3
        var Ssetup=Pivot+(High-Low)  //resistance2
        var Bbreak=2*Pivot-Low  //resistance1
        var Benter=2*Pivot-High  //Support position1
        var Sbreak=Pivot-(High-Low)  //Support position2
        var Bsetup=Low-2*(High-Pivot)  //Support position3
        //Draw line
        var nowTime = new Date().getTime(); //Get the timestamp,
        ObjChart.add([0, [nowTime,_N(Senter,3)]]); //resistance3
        ObjChart.add([1, [nowTime,_N(Ssetup,3)]]); //resistance2
        ObjChart.add([2, [nowTime,_N(Bbreak,3)]]); //resistance1
        ObjChart.add([3, [nowTime,_N(Pivot,3)]]); //Pivot point
        ObjChart.add([4, [nowTime,_N(Benter,3)]]);  //support point1
        ObjChart.add([5, [nowTime,_N(Sbreak,3)]]);  //support point2
        ObjChart.add([6, [nowTime,_N(Bsetup,3)]]);  //support point3
        ObjChart.add([7, [nowTime,_N(ticker.Last,3)]]); //Last transaction price
        ObjChart.update(chart);  // Update the chart to display it.
        */

        ///*
        //R-Breaker strategy
        //A up 7261.46 A middle 7246.76 A down 7228.68 B up 7204.48 B middle 7187.96 B down 7173.26
        var Ssetup = High + f1 * (Close - Low);  //A middle
        var Bsetup = Low - f1 * (High - Close);  //B down
        var Bbreak = Ssetup + f3 * (Ssetup - Bsetup);  //A up
        var Senter = ((1 + f2) / 2) * (High + Close) - f2 * Low;  //A down
        var Benter = ((1 + f2) / 2) * (Low + Close) - f2 * High;  //B up
        var Sbreak = Bsetup - f3 * (Ssetup - Bsetup);  //B middle
        //Draw line
        var nowTime = new Date().getTime(); //Get timestamp
        ObjChart.add([0, [nowTime,_N(Bbreak,3)]]); //A up
        ObjChart.add([1, [nowTime,_N(Ssetup,3)]]); //A middle
        ObjChart.add([2, [nowTime,_N(Senter,3)]]); //A down
        //ObjChart.add([3, [nowTime,_N(Pivot,3)]]); //Pivot point
        ObjChart.add([4, [nowTime,_N(Benter,3)]]);  //B up
        ObjChart.add([5, [nowTime,_N(Sbreak,3)]]);  //B middle
        ObjChart.add([6, [nowTime,_N(Bsetup,3)]]);  //B down
        ObjChart.add([7, [nowTime,_N(ticker.Last,3)]]); //Last transaction price
        ObjChart.update(chart);  // Update the chart to display it.
        //*/
        Log('A up',_N(Bbreak,3),'A middle',_N(Ssetup,3),'A down',_N(Senter,3),'B up',_N(Benter,3),'B middle',_N(Bsetup,3),'B down',_N(Sbreak,3));
}
function main() {
    Log("Strategy Startup");
    while(true){
        onTick(exchanges[0]);
        Sleep(1000);
    }
}
for more information, please see: https://www.fmz.com/bbs-topic/2269
