The average true range (ATR) is the moving average of the volatility of stock price in a certain period of time, which is mainly used to study and judge the trading opportunity.
The ATR is an indicator that shows the market change rate. It was first proposed by Welles Wilder in the book “New Concept in the Technology Trading System”, and has become the technical volume frequently cited by many indicators. Wilder found that higher ATR values often occur at the bottom of the market, accompanied by panic selling. When its value is low, it often occurs at the top of the market after the merger.
Due to the sharp drop in prices driven by panic buying, this indicator can usually reach a higher value at the bottom of the market. This indicator is very typical for the period of long-term continuous edge movement, which usually occurs at the top of the market or during the period of price consolidation. The Average Volatility Channel technical indicator is based on the same principle and it can be interpreted as some other volatility indicators. The principle of forecasting based on this indicator can be expressed as follows: the higher the value of this indicator is, the higher the possibility of trend change will be; The lower the value of this indicator is, the weaker the trend movement will be.
Calculation formula:
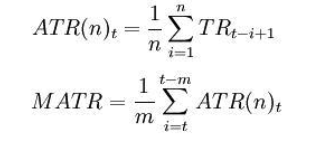
t – the current day;
n – length of time;
Ci – the closing price of the ith day;
Hi – the highest price of the i-th day;
Li – the lowest price of the i-th day.
Where:
TRi = max(Hi,Ci-1)-min(Li,Ci-1)
Note: generally take n = 14
, m = 6.
The ATR is a research and judgment signal whether it crosses the moving average from bottom to top or from top to bottom. It indicates that the trend of price operation is likely to reverse, and the specific change needs to be studied and judged comprehensively in combination with trend indicators.
The following is a trading strategy based on the SMA framework written in MyLanguage on the FMZ Quant platform.
LOTS:=MAX(1,INTPART(MONEYTOT/(O*UNIT*0.1)));
C_O:EMA(C,N)-EMA(O,N);
B:=CROSSUP(C_O,0);
S:=CROSSDOWN(C_O,0);
TR:=MAX(MAX((H-L),ABS(REF(C,1)-H)),ABS(REF(C,1)-L));
ATR:MA(TR,N);
BAND:=ATR*0.1*M;
PRICE_BPK:=VALUEWHEN(B,H+BAND);
PRICE_SP:=VALUEWHEN(B,L-BAND);
PRICE_SPK:=VALUEWHEN(S,L-BAND);
PRICE_BP:=VALUEWHEN(S,H+BAND);

// strategy logic
BARPOS>N AND C_O>0  AND C>=PRICE_BPK,BPK(LOTS);
BARPOS>N AND C_O<0  AND C<=PRICE_SPK,SPK(LOTS);

// place an order
S,SP(BKVOL);
B,BP(SKVOL);

C<=PRICE_SP,SP(BKVOL);
C>=PRICE_BP,BP(SKVOL);
For more information, please refer to: https://www.fmz.com/strategy/128136.
We use the FMZ Quant platform for backtesting and we can see that:
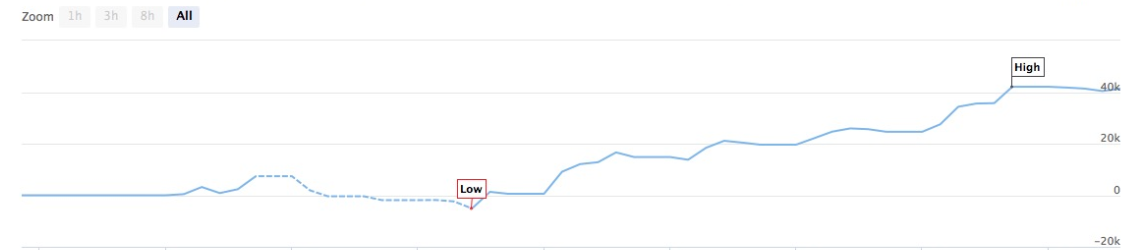
The data of domestic commodity futures are used for backtesting, and we can see that the results are very good. Readers can transplant the strategy to digital currency according to the framework. It should be noted that most of the digital currency markets are continuously traded 24 hours a day. If it is digital currency futures, there is no delivery problem. Most of the futures contracts of the mainstream digital currency exchanges are continuous contracts. This, on the contrary, reduces a lot of potential judgment logic errors for our strategy.