Introduction to DMI indicators
The DMI indicator is also called the momentum indicator or the trend indicator, the full name is “Directional Movement Index (DMI)”. It was created by American technical analysis guru Wells Wilder, it's a medium and long-term market technical analysis method.
The DMI indicator is a change in the equilibrium point of the buyers and sellers in the process of rising and falling of prices, that is to say, the change of the strength of both the long and the short sides is affected by the price fluctuations, and the cyclical process from equilibrium to imbalance occurs, thus providing a technical indicator for judging the trend.
Indicator calculation
Recently, a number of friends in the quantitative trading business have consulted me about how to use the DMI indicator on the FMZ Quant quantitative trading platform. I thought it was a very simple problem, and I opened the API documentation to find this indicator function. Found that this indicator is not available in the "versatile" talib indicator library. after some googling, I found some information.
It is found that this indicator is composed of four indicators. The algorithm is not very complicated. Simply follow the algorithm will be fine.
algorithm address: https://www.fmz.com/strategy/154050
- Source code
// indicator function
Function ADX(MDI, PDI, adx_period) {
    If(typeof(MDI) == "undefined" || typeof(PDI) == "undefined"){
        Return false
    }

    If(MDI.length < 10 || PDI.length < 10){
        Return false
    }

    /*
    DX = abs(DIPlus-DIMinus) / (DIPlus+DIMinus)*100
    ADX = sma(DX, len)
    */

    Var dx = []
    For(var i = 0; i < MDI.length; i++){
        If(!MDI[i] || !PDI[i]){
            Continue
        }
        Var dxValue = Math.abs((PDI[i] - MDI[i])) / (PDI[i] + MDI[i]) * 100
        Var obj = {
            Close : dxValue,
        }
        Dx.push(obj)
    }

    If(dx.length < adx_period){
        Return false
    }

    Var adx = talib.SMA(dx, adx_period)

    Return adx
}

Function DMI(records, pdi_period, mdi_period, adxr_period, adx_period) {
    Var recordsHLC = []
    For(var i = 0; i < records.length ; i++){
        Var bar = {
            High : records[i].High,
            Low : records[i].Low,
            Close : records[i].Close,
        }
        recordsHLC.push(bar)
    }

    Var m_di = talib.MINUS_DI(recordsHLC, mdi_period)
    Var p_di = talib.PLUS_DI(recordsHLC, pdi_period)

    Var adx = ADX(m_di, p_di, adx_period)

    // ADXR=(ADX of the day before the ADX+ AX)÷2
    Var n = 0
    Var adxr = []
    For (var j = 0 ; j < adx.length; j++) {
        If (typeof(adx[j]) == "number") {
            n++
        }

        If (n >= adxr_period) {
            Var currAdxr = (adx[j] + adx[j - adxr_period]) / 2
            Adxr.push(currAdxr)
        } else {
            Adxr.push(NaN)
        }
    }

    Return [m_di, p_di, adx, adxr]
}
- Comparing
Using the data library of FMZ Quant, it is easy to draw a chart and compare DMI with other charts.
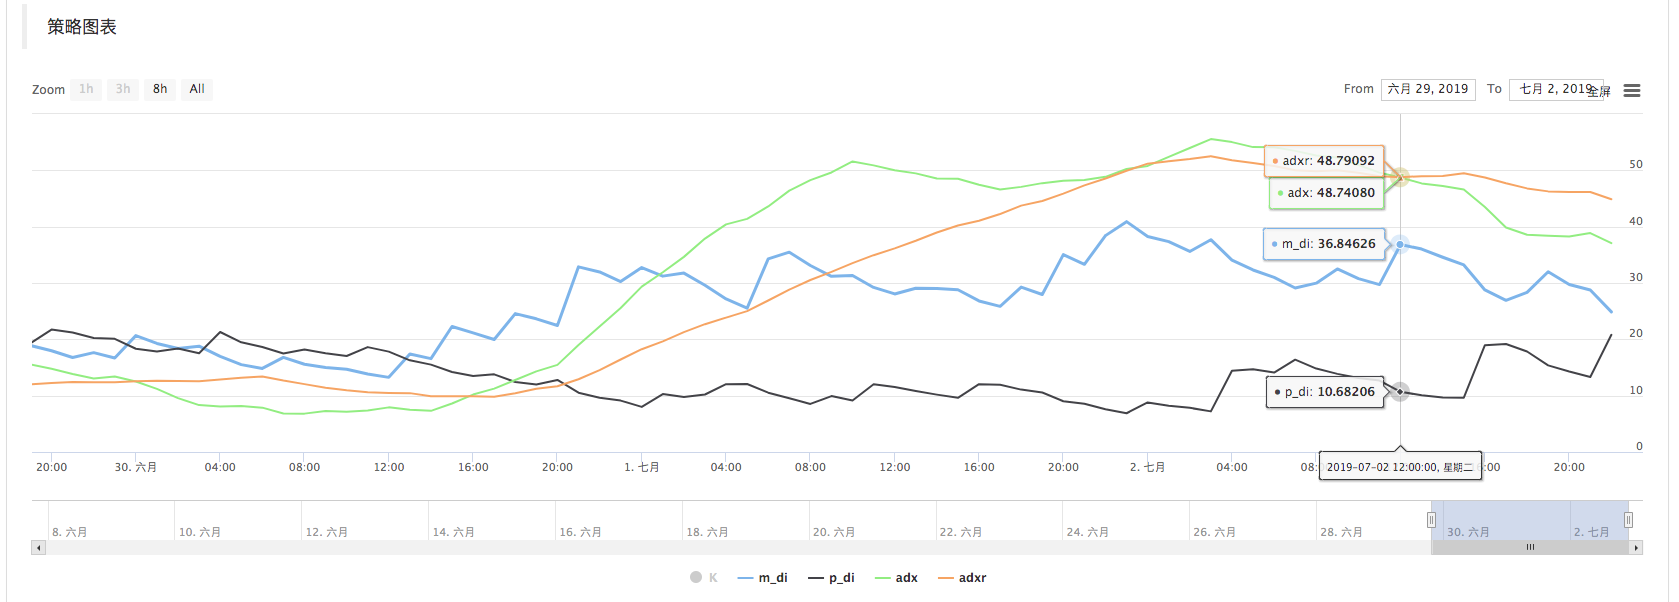
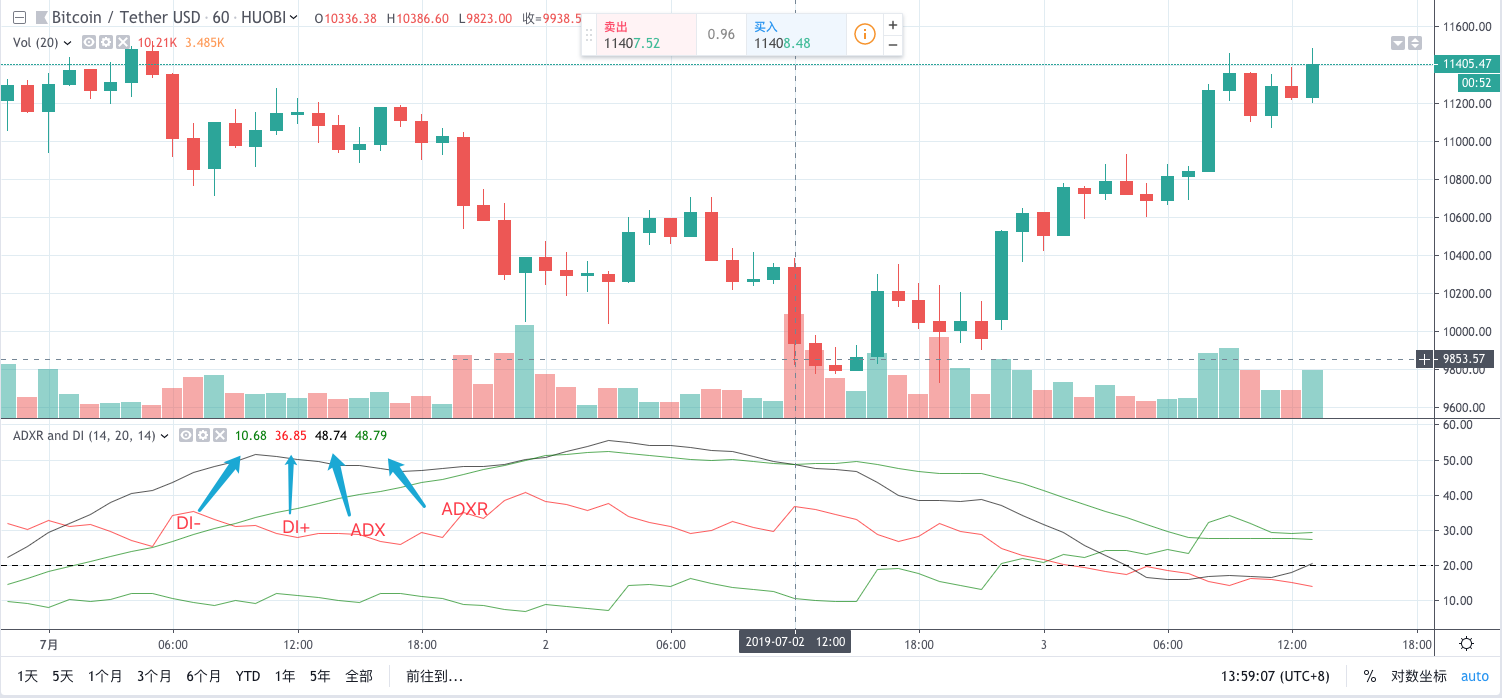
Comparing the indicator values on several k-line bars, the values are basically the same (slightly rounded deviation).
- Usage
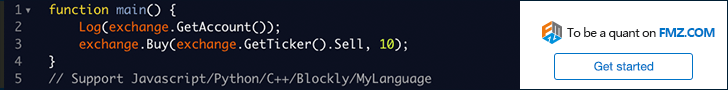
Directly use the DMI function (such as the way called in the main function in the example), pass in the K line data, set the indicator parameters, which are generally 14.
The data returned by the function is a two-dimensional array representing four lines.
DI- : m_di
DI+ : p_di
ADX : adx
ADXR: adxr
Among these four lines of DMI indicator, DI- and DI+ are long and short indicators, reflecting the strength of both long and short position.
ADX and ADXR are a pair of indicator lines used together, which are trend indicators, reflecting the current trend and direction of the market.
DI+, the higher the indicator value, the stronger the current bull market, otherwise the weaker the bull market.
DI-, the opposite of above.
DI+, DI- are often intertwined, and the closer the value is between, the market is in a deadlock. Conversely, the trend is enhanced.
Signal
- Price bottom signal
After a long-term price decline, if the following conditions are met in the short term, it indicates that the short-term price bottom has been reached, and there may be a rebound or reversal.
The DI+ line which representing the long-buying strength is below 10, and the line is turned upwards in the oversold position, and the DI-line is at the high position.
The ADX line which representing the trend is at a higher position above 65, turning down and forming a down-cross with the ADXR line.
- Price top signal
After a long-term rise, if the following conditions are met in the short term, the short-term high price has been reached and there may be short-term adjustments or reversals.
The DI-line which representing the short-selling strength is below 10, and the line is turned upwards at the low position, and the DI+ line is at a high position.
The ADX line which representing the trend is at a higher position above 65, turning down and forming a down-cross with the ADXR line.
- Rising of the trend
After a period of fluctuations in the price movement, DMI's four indicator lines are intertwined at the low price, and then suddenly there is a long positive k-line with large volume increasing the price over 5%. DI+ line continuously cross the DI- line, ADX line and ADXR line within two days, indicating that a new uptrend will be formed. You can open position when the DI+ line up cross the last indicator line.