Recently, I have summarized some key insights from papers studying limit order books. You will learn how to measure the imbalance of transaction volume in the order book and its predictive ability for price trends. This article explores methods of using order book data to model price changes.
First, let’s talk about the order book.
Exchange order book balance refers to the relative balance state between buy and sell orders in an exchange. The order book is a real-time record of all pending buy and sell orders on the market. This includes orders from buyers and sellers who are willing to trade at different prices.
Below are some key concepts related to exchange order book balance:
- Buyer and Seller Orders: Buyer orders in the order book represent investors willing to purchase assets at a specific price, while seller orders represent investors willing to sell assets at a specific price.
- Order Book Depth: Order book depth refers to the number of orders on both the buyer and seller sides. A greater depth indicates there are more buy and sell orders in the market, which may be more liquid.
- Transaction Price and Transaction Volume: The transaction price is the price of the most recent trade, while the transaction volume is the quantity of assets traded at that price. The transaction price and volume are determined by the competition between buyers and sellers in the order book.
- Order Book Imbalance: Order book imbalance refers to the discrepancy between the number of buy and sell orders or total transaction volume. This can be determined by examining the depth of the order book, if one side has significantly more orders than the other, there may be an order book imbalance.
- Market Depth Chart: The market depth chart graphically presents the depth and balance of the order book. Typically, the number of orders from buyers and sellers is displayed on the price level in a bar chart or other visual ways.
- Factors Affecting the Price: The balance of the order book directly affects market prices. If there are more buy orders, it may push up the price; on the contrary, if there are more sell orders, it may cause a drop in price.
- High-frequency Trading and Algorithmic Trading: Order book balance is crucial for high-frequency trading and algorithmic trading, as they rely on real-time order book data to make decisions, aiming to seize market opportunities quickly.
Understanding the balance of order books is important for investors, traders, and market analysts, because it provides useful information about market liquidity, potential price direction, and market trends.
Imbalance in Trading Volume
A key idea when analyzing limit order books is to determine whether the overall market tends to buy or sell. This concept is known as imbalance in trading volume.
The imbalance in trading volume at time t is defined as:
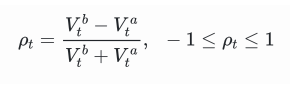
Where,

represents the transaction volume of the best buy order at time t,

represents the transaction volume of the best sell order at time t. We can interpret ρt close to 1 as strong buying pressure, and ρt close to -1 as strong selling pressure. This only considers the transaction volumes of orders placed at the best buy price and best sell price, that is, L1 order book.
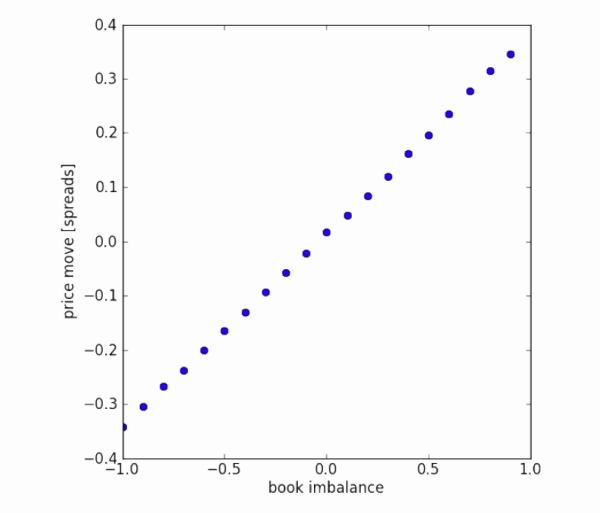
Imbalance in trading volume and price changes. The graph shows the imbalance of tiered trading volumes (x-axis) and the average value of future price movements, standardized by price difference (y-axis). The dataset is a quarter’s order flow from a certain market. There seems to be a linear relationship between first-level order imbalance and future price changes. However, on average, future price changes are within the bid-ask spread.
The imbalance in trading volume ρt will be divided into the following three paragraphs:

It was discovered that these segments can predict future price changes:
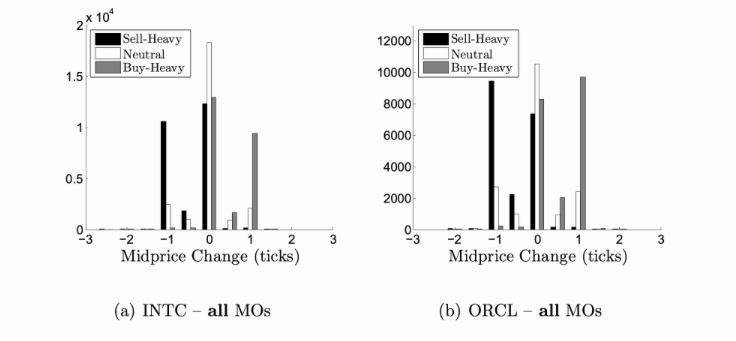
Regarding the predictive ability of volume imbalance, an analysis was conducted on the tick-by-tick order book of a certain commodity from January 2014 to December 2014. For each arriving market order (MO), the volume imbalance was recorded and segmented according to the number of ticks in which the mid-price changed within the next 10 milliseconds. The chart shows the distribution and mid-price changes for each segment. We can see that positive price changes are more likely to occur before order books with greater buying pressure. Similarly, negative changes are more likely to occur before order books with greater selling pressure.
Order Flow Imbalance
The imbalance of trading volume focuses on the total trading volume in the limit order book. One drawback is that some of this volume may come from old orders, which contain less relevant information. We can instead focus on the trading volume of recent orders. This concept is known as order flow imbalance. You can achieve this by tracking individual markets and limit orders (requires Level 3 data) or observing changes in the limit order book.
Since Level 3 data is expensive and usually only available to institutional traders, we will focus on changes in the limit order book.
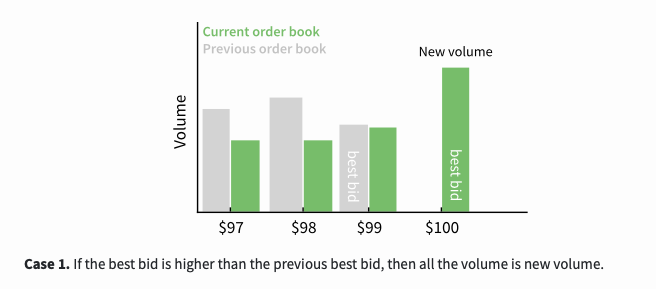
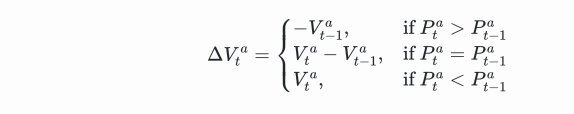
We can calculate the order flow imbalance by looking at how much the trading volumes have moved at best bid price and best ask price. The change in trading volume at best bid price is:

This is a function involving three scenarios. The first scenario is, if the best buying price is higher than the previous best buying price, then all transaction volumes are new transaction volumes.
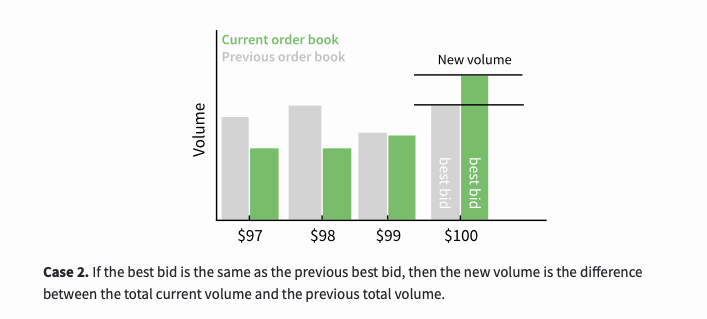
The second scenario is, if the best buying price is the same as the previous best buying price, then the new transaction volume is the difference between the current total transaction volume and the previous total transaction volume.
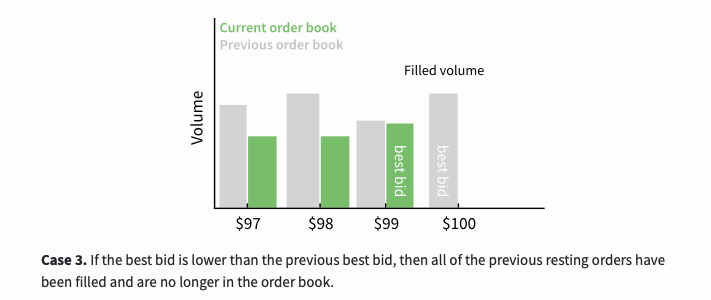
The third scenario is, if the best buying price is lower than the previous best buying price, then all previous orders have been traded and are no longer in the order book.
The calculation method for the change in transaction volume at the best selling price is similar:
The net order flow imbalance (OFI) at time t is given by the following formula:
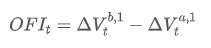
This will be a positive value when there are more buy orders, and a negative value when there are more sell orders. It measures both the quantity and direction of the transaction volume. In the previous part, order imbalance only measured direction without measuring the quantity of transactions.
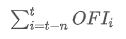
You can add these values to get the net order flow imbalance (OFI) over a period of time:
Use regression models to test whether order flow imbalance contains information about future price changes:
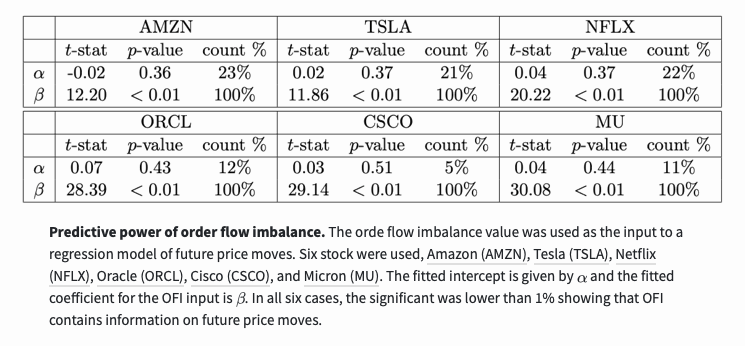
The calculated OFI value above focuses on the best buying price and selling price. In part 4, the values of the top 5 best prices were also calculated, providing 5 inputs instead of just one. They found that a deep study of the order book can provide new information for future price changes.
Summary
Here, I have summarized some key insights from papers studying the order volume in limit order books. These papers indicate that the order book contains information highly predictive of future price changes. However, these changes cannot overcome the bid-ask spread.
I have added links to the papers in the references section. Please refer to them for more detailed information.
References & Notes
- Álvaro Cartea, Ryan Francis Donnelly, and Sebastian Jaimungal: “Enhancing Trading Strategies with Order Book Signals” Applied Mathematical Finance 25(1) pp. 1–35 (2018)
- Alexander Lipton, Umberto Pesavento, and Michael G Sotiropoulos: “Trade arrival dynamics and quote imbalance in a limit order book” arXiv (2013)
- Álvaro Cartea, Sebastian Jaimungal, and J. Penalva: “Algorithmic and high-frequency trading.” Cambridge University Press
- Ke Xu, Martin D. Gould, and Sam D. Howison: “Multi-Level Order-Flow Imbalance in a Limit Order Book” arXiv (2019)
Reprinted from: Author ~ {Leigh Ford, Adrian}.